The Value Rank

It has long been understood that cheap stocks have a tendency to outperform expensive stocks in the stock market. While that doesn't happen every single year, over almost every three-year cycle in the stock market, cheap (or value) stocks outperform. This phenomenon has created the cult of 'Value Investing' born from the writings of Benjamin Graham and the phenomenal success of its arch proponent, Warren Buffett.
The Stockopedia Value Rank is a blend of several of the most important value ratios and has been found, when used in a portfolio approach, to outperform the use of any of these value ratios on their own.
It should though be noted that 'cheap' stocks are often distressed, junk or low quality stocks and can often be highly volatile as a result - so one should be careful in the very highest ValueRank companies. Investing in these kind of stocks is known as 'bargain' investing and can require a lot of finesse. A safer way to invest in value stocks is to find the best quality value stocks or value stocks whose share prices are turning around - filtering the wheat from the chaff. At Stockopedia we always recommend the rule of thumb of twinning the Value Rank with either the Quality Rank or the Momentum Rank to help avoid value traps.
How does Stockopedia calculate the ValueRank?
Our ValueRank is based on a composite of the following Value factors:
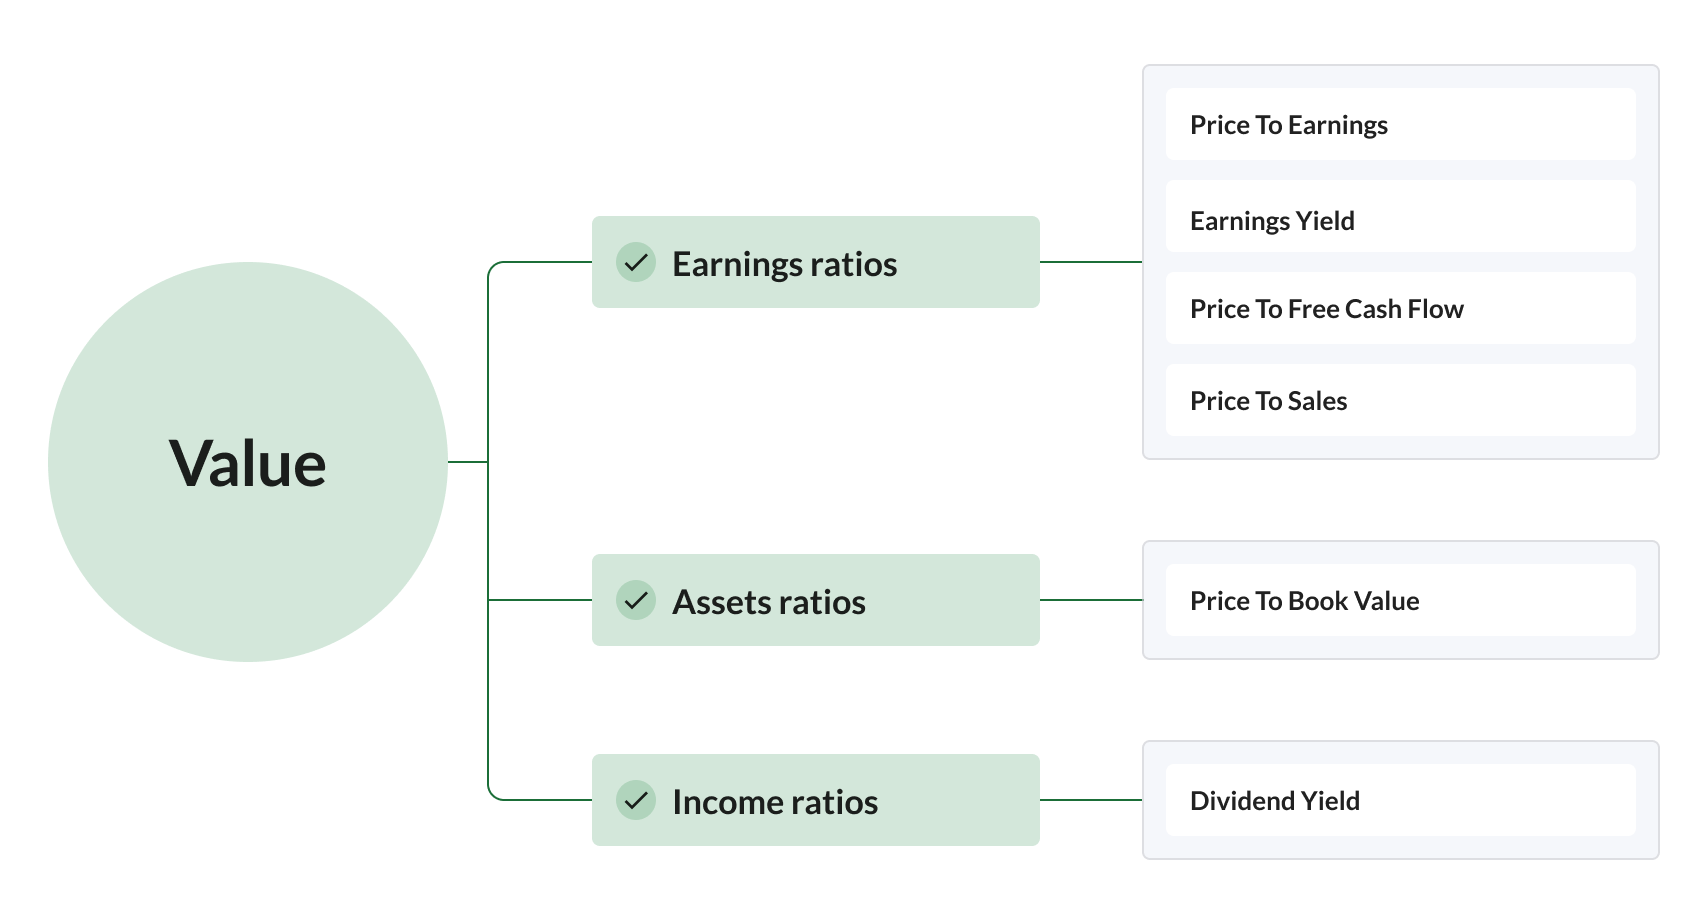
Consistent with the value investing philosophy, we use historic ratios for each of these metrics, rather than factoring in analyst forecasts. Each company in the market is ranked from 1 to 100 for each of these value ratios and a composite score is calculated as the weighted average of all valid values. The ValueRank™ is then calculated between zero and 100 for this composite score, where 100 is best and zero is worst.
Why these ratios?
Composite value scoring systems have been used successfully by many investors since Ben Graham originally designed his 'multiplier' that blended the P/E ratio and P/B ratio. This work has been extended by data driven investors for decades, and composite value scores & indices have been published by institutional investment platforms like Starmine, Morningstar, S&P and Societe Generale. One of the most classic and inspiring studies is by James O'Shaughnessy in the 4th edition of What Works on Wall St[1] in which he showed that composite value factors based on an average ranking of 6 ratios - P/S, P/E, P/B, P/CF, EBITDA/EV, and Shareholder Yield (dividends+buybacks) - dramatically beat the market.
Given that during different market environments different value ratios perform better it's perhaps unsurprising that if you buy the cheapest stocks in the market based on this composite measure you can achieve better overall returns with less risk over the long run than using the ratios individually.
Performance of the Value Rank
Our approach to ranking value has proven powerful, as illustrated by the returns to annually rebalanced portfolios, grouped in 10 ascending value buckets, in the UK since April 2013 below. The 'cheapest' stocks are those with the highest rankings (on the right) while the expensive are on the left.
Stocks ranking between 90 and 100 by the Value Rank have returned over 11% annualised over this time period before dividends. While there is not a perfect sequence in the return series, the higher payoff to 'cheap' stocks is markedly clear.
It is worth noting that the benchmark (FTSE All Share in grey) has a lower return than the majority of the ranking buckets due to its market cap weighting. Its returns have been dragged down, below the average performance of most stocks in the market, by the largest stocks in the market underperforming during this time period. This is evidence that market cap weighting can be a significant drag on returns in some market regimes.
Guide to using the Value Rank
While the performance of high Value Rank stocks has been impressive it's important to remember that these measurements are based on averages. Individual high Value Rank stocks can have a very wide dispersion of outcomes - with some indeed going bust.
Cheap stocks often are out of favour due to suspicion over their business model or sustainability as a business. Be aware that some can be Value Traps that don't recover. When assessing high Value Rank stocks it's best to use additional filters to find better quality or higher momentum shares to avoid traps.
The answer to this question is simply because Quality is not factored into the Value Rank. We model it separately as the QualityRank which we'll define in the next section. The Value Rank is a pure measure of cheapness. And cheap, bargain or deep value stocks have a far higher likelihood of being financially distressed.
So how do you avoid the impact of owning these kinds of stocks if you invest using the Value Rank as part of your strategy?
There are two solutions.
The first is to diversify. Benjamin Graham advised diversification across a basket of value shares to minimise the downside contribution of the losers.
“Even with a margin of safety in the investor’s favor, an individual security may work out badly. But as the number of such commitments is increased, the more certain does it become that the aggregate of the profits will exceed the aggregate of the losses.”
The second is to use it in combination with other factors. By filtering a list of cheap stocks further, for profitability, cashflow, balance sheet strength or otherwise, an investor can minimise the selection of dreaded Value Traps.