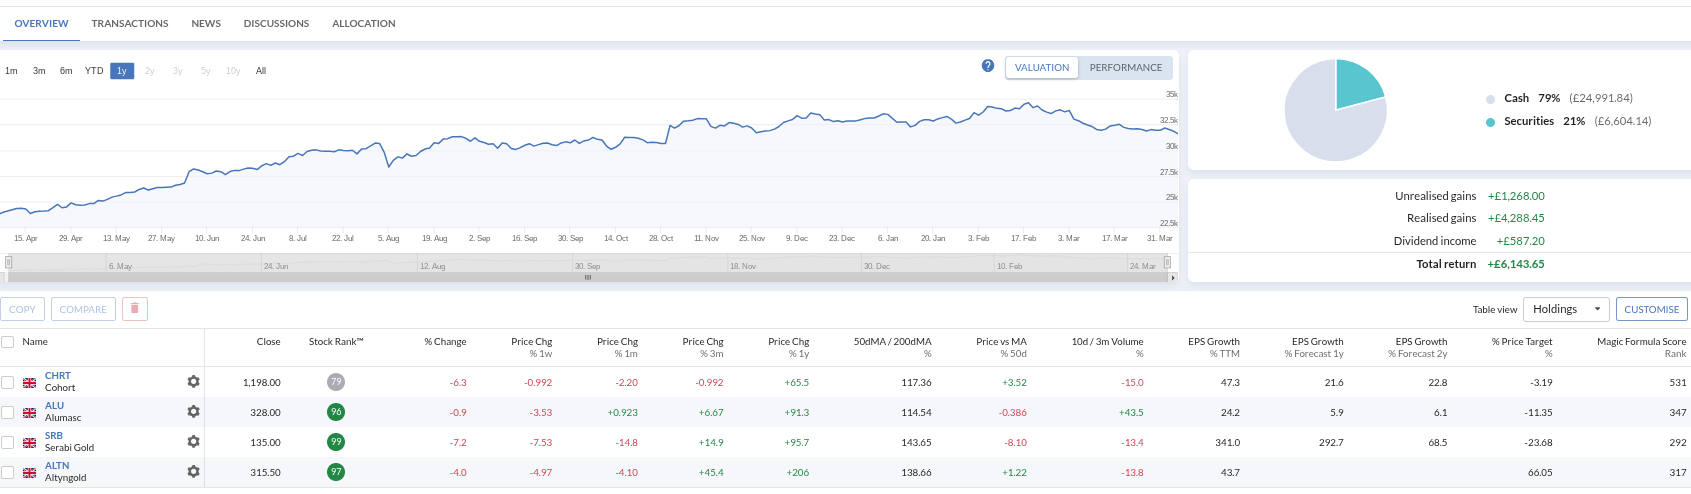
Ever been in a situation where you’ve loved a stock, but waited and waited for the correction that never came? I’ve been watching Warpaint London (LON:W7L) for a long time as it has many of the traits of multibaggers, but I couldn’t bring myself to buy as the price trend never corrected. I should have known better!
It turns out that shares that stocks that have the clearest price trends have the strongest momentum effects. A recent paper titled Trended Momentum delves into this idea in depth.
The authors demonstrate that shares with distinct price trends more than double the returns to a standard momentum strategy. This has pretty profound implications both for stock pickers and systematic investors who wish to improve their investment results.
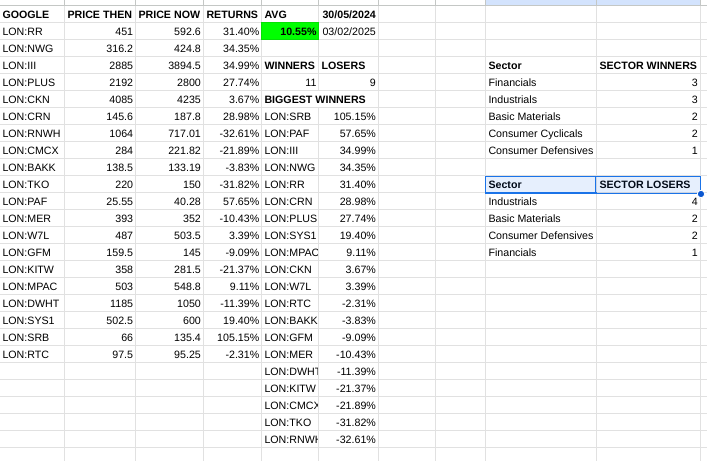
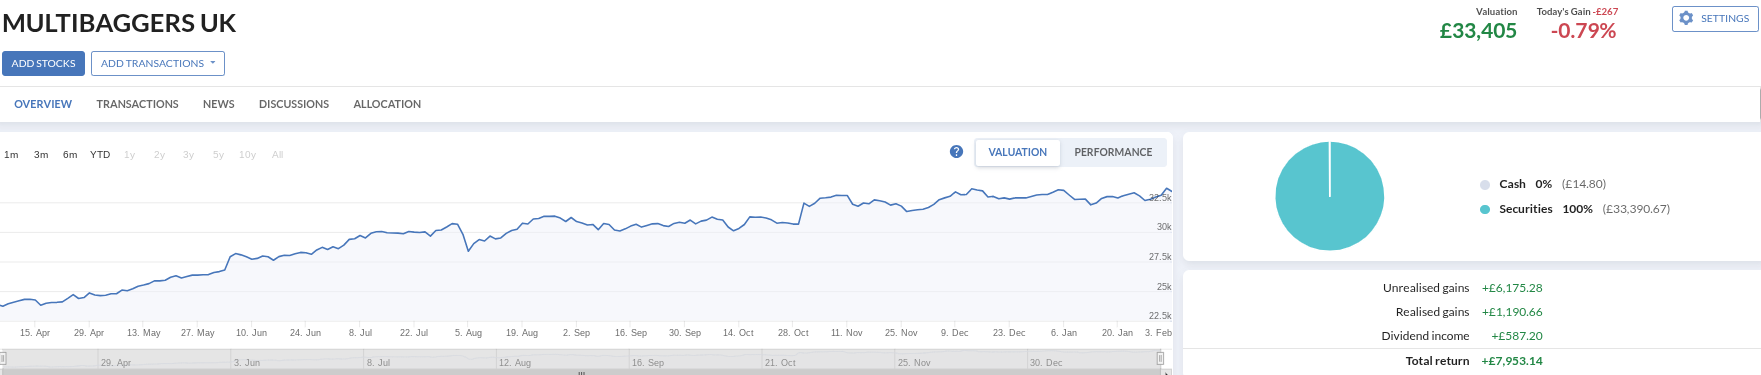
More than this, I’ve found that separating the 80+ StockRank universe at Stockopedia.com into a high Trend Clarity set enhances the returns of a 20 stock UK portfolio to more than 14.8% annualised since 2013. Let’s dive in.
What is trend clarity?
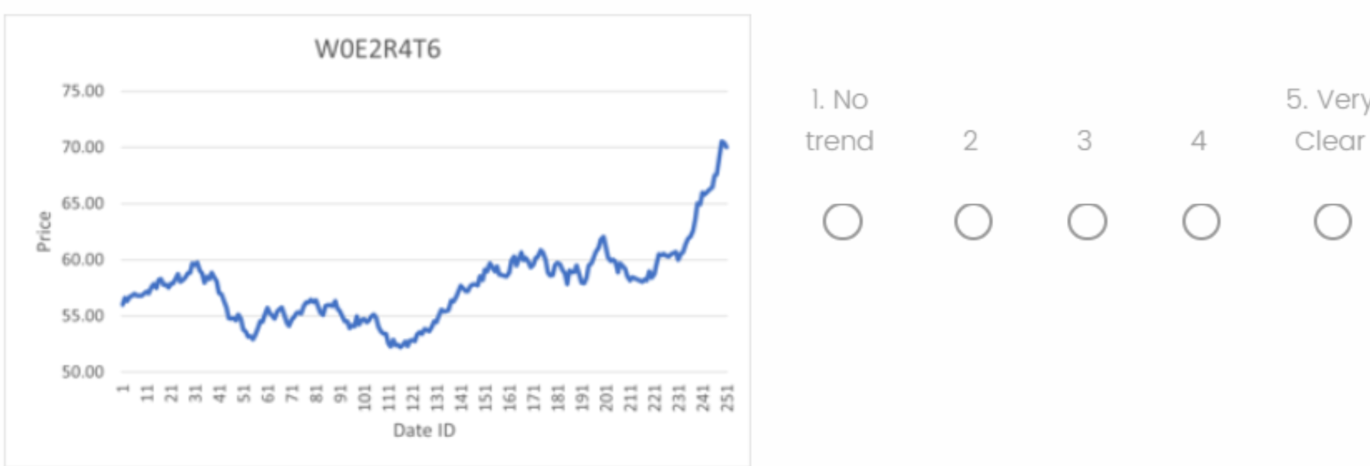
The authors of the study theorised that clear and distinct trends are more favoured by investors. They devised an online experiment involving 128 participants who were given charts to assess and rank for trend clarity. They were asked to evaluate the trends of charts from “no trend” to “very clear”.
If you remember statistics classes from school then you’ll have a fair memory of drawing lines of best fit across scatter plots. This is called Linear Regression, and is used extensively across many domains. As you can see below Price Path A (left) has a much better line of best fit than Price Path B (right). It has more trend clarity.
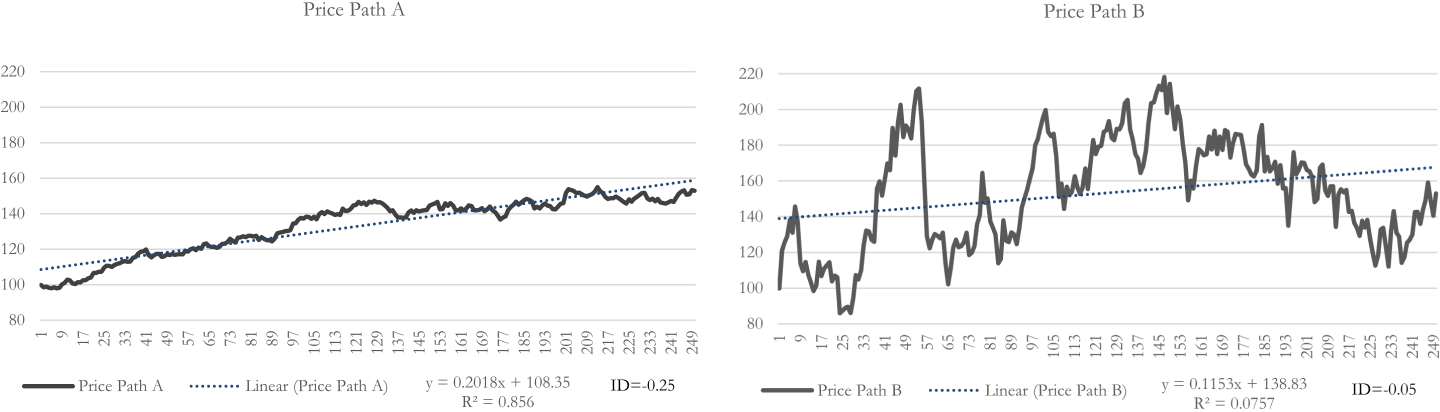
There’s a number, called the R-Squared (or R2) which defines how accurately the scatter can be defined by a line of best fit. A has an R2 above 0.8, B only 0.07. This allows a numerical calculation of the trend clarity. The authors found that using the R2 is a great proxy for finding the same kinds of charts that the survey respondents identified intuitively as having clear trends.
This is a simple approach, and can be replicated in any spreadsheet application - Google Sheets or Excel.
How useful is trend clarity?
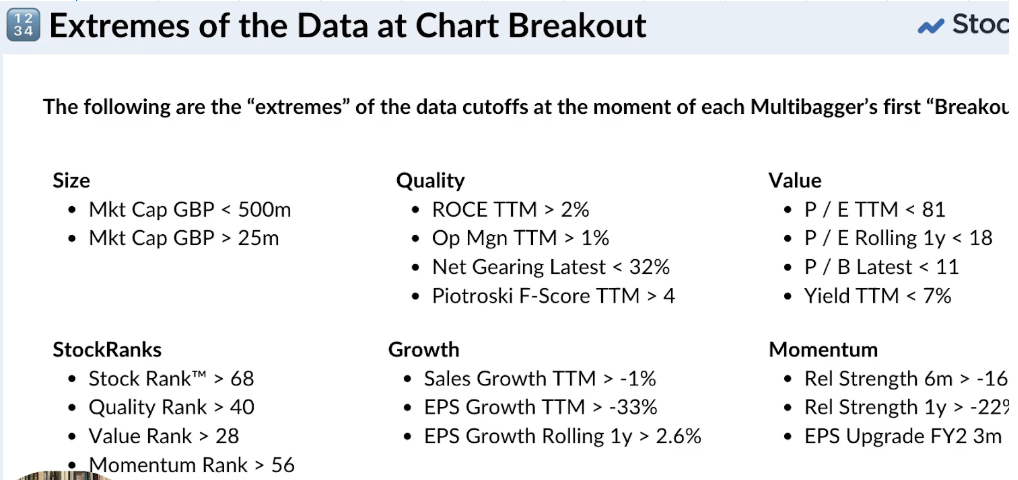
The authors separated all the stocks in the market into five buckets…