How to spot companies that are a bankruptcy risk

First let’s clarify what bankruptcy means. We all know it’s a bad thing, but the use of the word interchangeably with other terms for financial calamity can cause a bit of confusion when it comes to financial analysis.
Bankruptcy is the legal process through which companies which cannot pay their creditors may seek relief from their indebtedness. The legal process is initiated when a company is deemed insolvent - meaning it can’t pay the debts that it owes to its creditors or meet its financial obligations on time.
And so, to monitor companies for bankruptcy risk, it's important to have a good understanding of company solvency and indebtedness. The following article aims to help investors of all levels of expertise get to grips with debt and solvency. We’ll be starting with the basic elements that can act as red flags - these are useful to help novices (who perhaps don’t have the time to dig exhaustively through company accounts) identify companies that it might be best to avoid. We’ll then go on to explore more advanced analysis techniques, perhaps for those of you who are looking for short ideas.
What is the company’s net debt position?
Net debt is the sum of all short and long-term debt minus cash.
Companies report all the individual elements of their cash and debt on their balance sheet, separated into money owed in the short term (normally defined as less than one year) and money that is owed in the long term.
To add confusion to what should really be quite a simple metric, there is no one definition of net debt. Some companies include the money owed to all creditors in their net debt figure (this might include the money owed to a pension scheme, for example). Other companies have multiple elements that contribute to their cash position (such as short-term investments in equity markets).
In order to compare like-with-like it is best to stick to one clear definition of net debt. At Stockopedia, we like: “the sum of all Short Term Debt, Notes Payable, Long Term Debt and Preferred Equity minus the Total Cash and Equivalents and Short Term Investments for the most recent reporting period.”
It is generally accepted that high levels of net debt are a bad thing. But taken in isolation, the net debt figure does not mean very much. The screenshots below are taken from the Stock Reports of two retail companies (Next (LON:NXT) and then Superdry (LON:SDRY) ) which have different levels of debt.
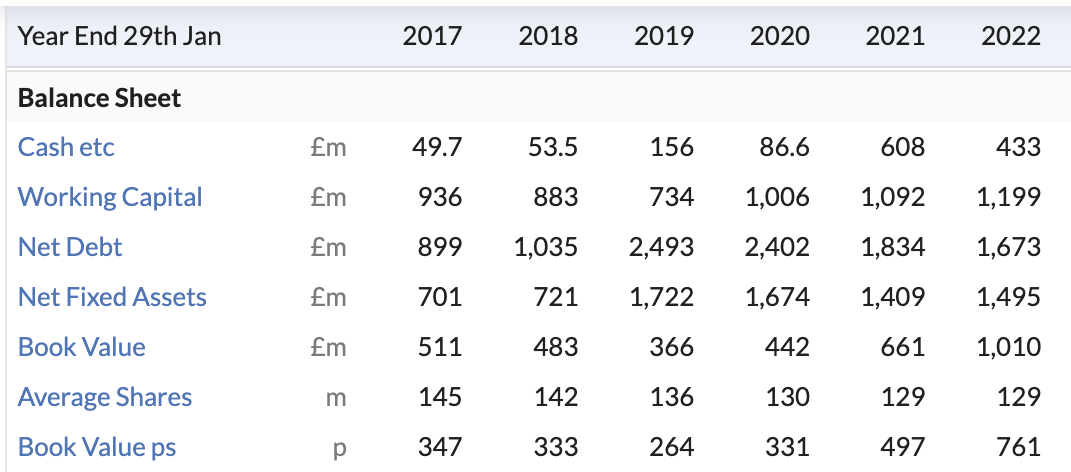
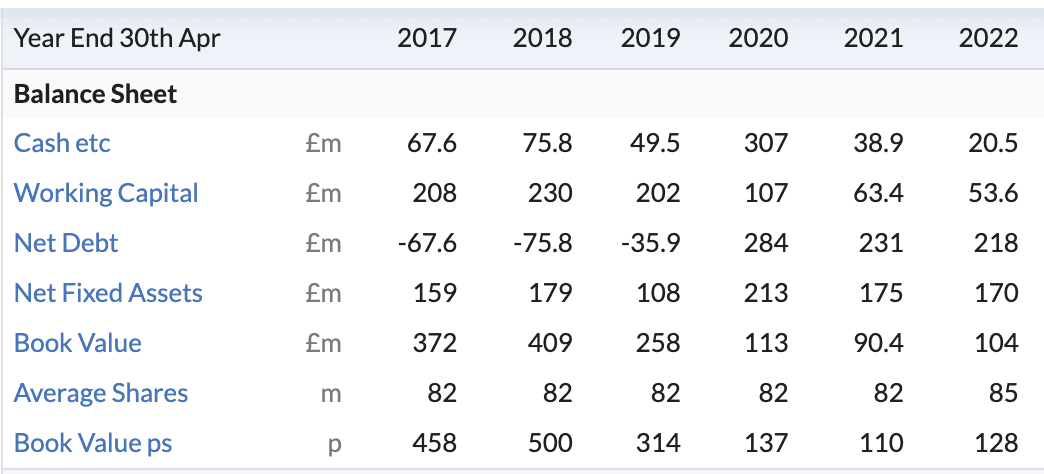
For example, retailer Next has £1.7bn of debt, which has fallen from almost £2.5bn in 2019. Next - an £8.7bn company which generated £4.9bn of revenue in the 2022 financial year. When used sensibly, big companies can leverage debt to stimulate new revenue and profit. By contrast its peer Superdry has £218m of debt, more than than the entire market capitalisation of the company right now (£97m). Thus, high and rising debt looks like it could be problematic.
How does the company’s debt compare to its size?
Which leads us onto the second point for consideration: gearing.
Gearing is a measure of the company’s debt as a proportion of its equity. In other words, it shows how encumbered a company is with debt. At Stockopedia, we calculate two different types of gearing. Gross gearing, which measures a company’s total debt divided by the book value of its equity and net gearing, which measures a company’s net debt (total debt minus cash) against its equity. Companies in a net cash position will have negative net gearing scores.
As a general rule of thumb, lower gearing is better and net gearing of over 100% is a cause for concern.
But again, the gearing figures are worth assessing in context. Some large businesses tick along for years with very high gearing figures without any fear of bankruptcy. But high gearing becomes a problem during times of financial distress, either on a macro or micro level.
For example, the screenshots below come from the historic Stock Report (taken on 1 February 2022) and current Stock Report for telecoms giant Vodafone (LON:VOD) . They show that gearing is high and rising at both the net and gross level.

If we drill down into what has caused that increase, we can see that net debt has risen enormously over the last few years.
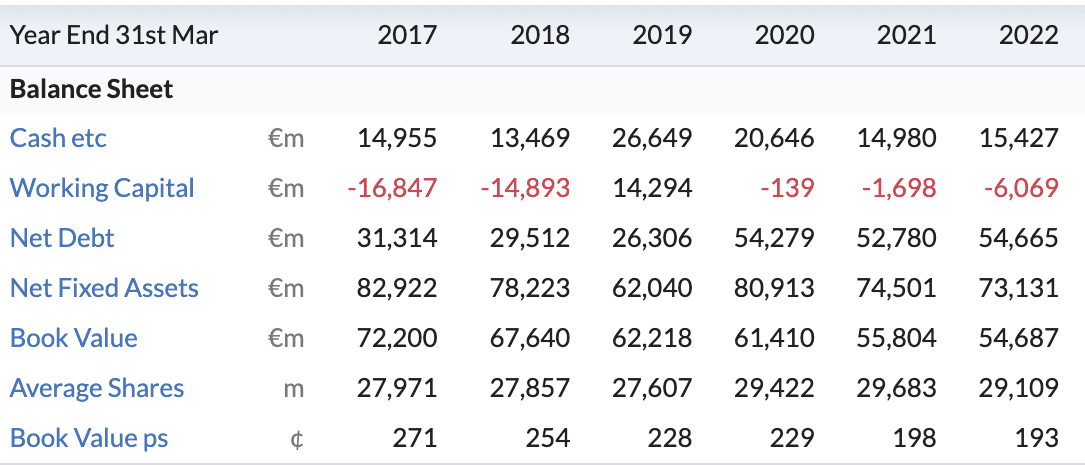
The company accounts reveal that the rising debt is a symptom of massive expenditure requirements which have been necessary to keep the company competitive in the world of modern telecoms. In other words, micro issues on the company and industry level have forced the company to borrow more money. That is a big red flag.
On the macro level, high borrowing is a problem in times of economic distress because of interest rate rises. When central banks send interest rates higher in a bid to encourage saving and temper inflation, the cost of borrowing for companies increases. And this is especially problematic for those with lots of debt.
How expensive is company debt?
On to point number 3: how expensive is company debt? In other words, how much interest is the company paying on its debt?
Interest rate payments are reported in both the income statement and the cash flow statement in company accounts, but a simple way of assessing whether interest payments are problematic is by using the interest coverage ratio.
Interest coverage refers to how many times a company can pay the interest due on its debt with operating profits generated in the previous year. If a company has an interest rate coverage of less than 1, it means they can’t pay their interest payments with profits and will then have to turn to their cash stores or borrow more funds to settle the obligation on existing debt.
But investors shouldn’t be satisfied with a low interest coverage ratio - at Stockopedia, we deem it problematic when the coverage is less than 2.5. Companies shouldn’t be spending anywhere near 100% of their operating profits just paying for their debt. If a company has to spend a lot of its operating profits on interest payments, it is fair to assume it isn’t investing efficiently in growth.
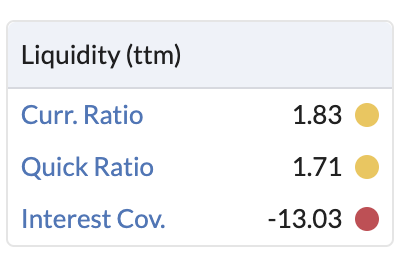
Oxford BioMedica (LON:OXB) (whose liquidity ratios are shown in the screenshot below) has become a classic example of a company trapped by poor interest coverage. The early-stage pharmaceutical company was forced to borrow money to fund ambitious expansion plans at a high interest rate, but with no profits to speak of it was forced to pay for the interest on that borrowing out of its cash and eventually had to borrow more money. The negative interest coverage ratio in the screenshot below shows that the company is loss making, but having to pay high interest on its debt.
Can we use the Altman-Z Score as a sign of bankruptcy risk?
The final red flag that we’ll cover in this article is the Altman Z-Score - a combination of five weighted business ratios that is used to estimate the likelihood of financial distress (you can read more about the score in this article). Taken at face value the Z-Score can be a helpful indicator of potential financial distress: companies with a low Z-Score are at higher risk of financial distress than those with a higher Z-Score and novice investors can use this indicator as a sign they should potentially seek a safer stock.
But the Z-Score is not without its faults. Because it is a relatively blunt tool, companies can be swept up into the ‘red zone’ based on nothing more dangerous than a quirk in accounting. Investors with more time on their hands might want to do some digging to understand exactly why certain stocks have a low Z-Score.
For example, a company with very low inventory (a software or services company for example) might have a negative working capital position (current liabilities exceed current assets) without there being any real risk to the business. As working capital is a key component in the Z-Score, such a company would have a low Z-Score.
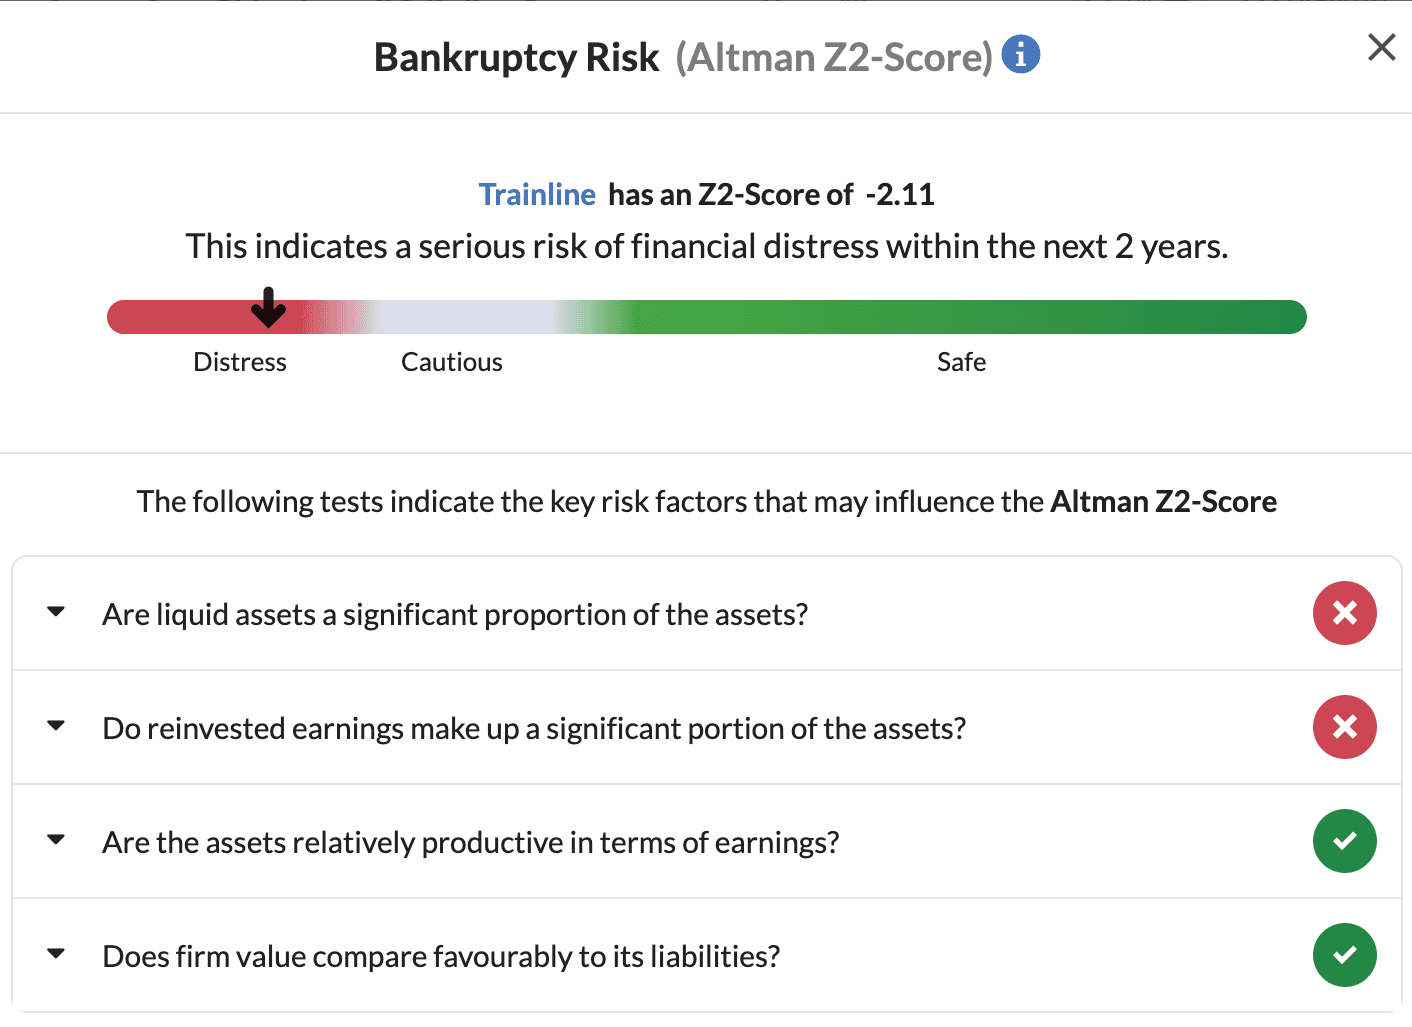
The screenshot below shows the Z-Score of British software company Trainline (LON:TRN) . The company currently has a negative working capital position because it has no inventory and very low receivables (meaning it collects cash from its revenues very efficiently).
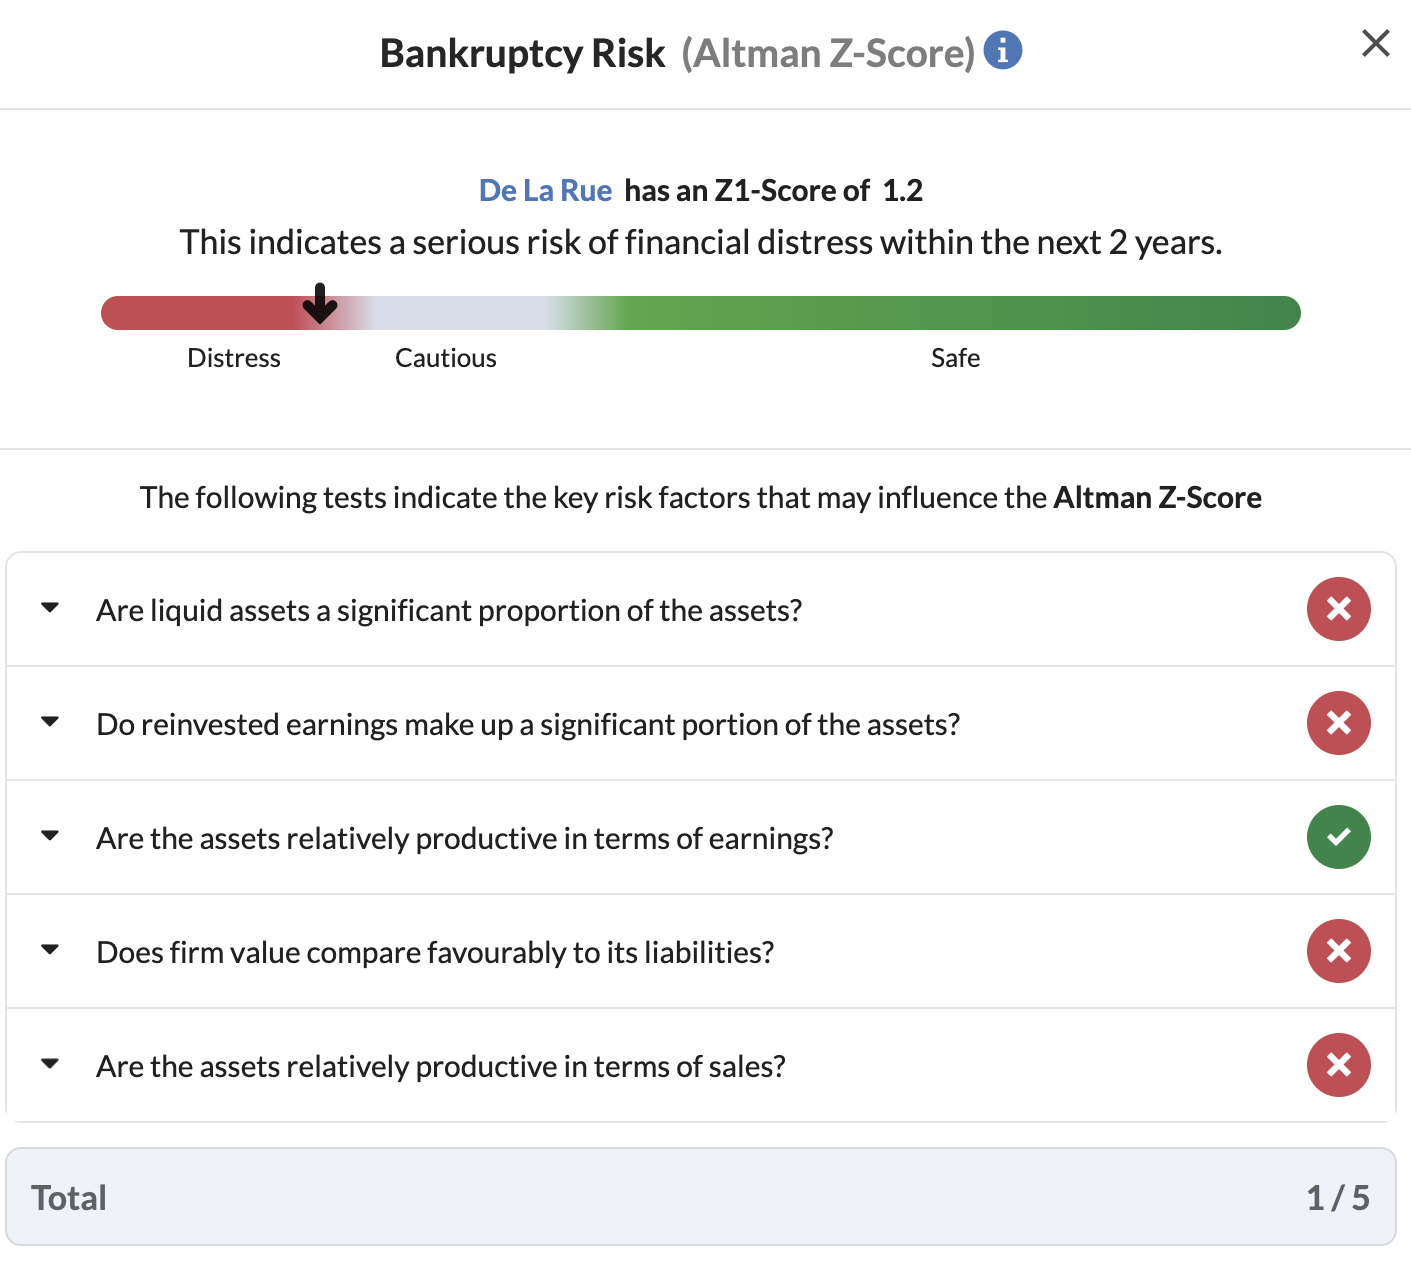
By contrast, the Z-Score is probably a useful indicator of distress at De La Rue (LON:DLAR) The company has worryingly low figures in four of the five metrics which are used to determine the final score. Most notably, the market value of the company (defined here as its market capitalisation plus debt) is significantly lower than the book value of its liabilities. That means more than 100% of the value of the business is accounted for by debt - a very bad sign.
Going Deeper: Checking the terms
More experienced investors can use company accounts to gain a better understanding of the debt position. The notes of the accounts contain details of the terms with which money has been loaned. This includes the interest rate on different portions of the loans, the currency in which the loans are denominated, the time-frame over which the money has been lent and the terms it has been lent under.
For investors who might be worried about the net debt or gearing, these details can provide useful context.
For example, let’s return to our example of a painfully-indebted company and take a closer look at the debt situation at Vodafone. At the last set of financial results (for the six months to September 2022), the company reported net debt of €45.2bn - a figure that included investment in liquid assets. Taking Stockopedia’s definition, the company’s net debt position was €60.7bn, equivalent to net gearing of 109%. So far, so bad.
Digging into the details, Vodafone discloses that €15.7bn of its total €75.6bn borrowing is “current” or due to be repaid within a year. That’s a bit of a concern for a company whose cash flows seem to be in perpetual decline.
The company has a small proportion of bank debt and some lease liabilities, but the vast majority of its borrowings come in the form of bonds. The company discloses that all of its bonds are held at fixed interest rates and the weighted average cost of this debt is 2.5%. The average bond maturity is 11 years. For all of the bonds denominated in a foreign currency, the company has hedged against any interest rate moves.
The big issue here is the cost of that debt - 2.5% doesn’t seem like a hugely expensive rate, but it adds up to a pretty big figure when the total debt pile is so huge. What’s more, in the current economic environment, the cost of borrowing is likely to rise and if Vodafone continues to look more and more financially frail it will have to offer even higher interest rates on its bonds, sending the cost of borrowing up even more.
In January, the company heeded investor calls to slice off a chunk of its debt by selling its Hungarian business for cash. Such is the fate which awaits companies with unmanageable levels of borrowing.