How to identify stocks with improving fundamentals

In the vast sea of investment opportunities, navigating towards quality stocks that can better weather market storms and deliver consistent returns over time is paramount. While many investors acknowledge the importance of quality, identifying it amid the noise of financial markets can be challenging. The quest for high-quality stocks involves distinguishing firms with robust financial health, solid competitive advantages, and sustainable growth prospects from those with weaker, deteriorating fundamentals. Fortunately, the Piotroski F-Score – a powerful tool devised by Joseph Piotroski, an accounting professor at Stanford University, offers investors a structured approach to assessing the fundamental health of companies. The F-Score's systematic methodology enables investors to sift through a plethora of financial data, honing in on companies that exhibit improving financial performance and operational efficiency. By focusing on key financial indicators such as profitability, leverage, liquidity, and operational efficiency, the F-Score provides a clear and concise measure of a company's fundamental momentum.
In this article, we’ll explore how investors can harness the potential of the Piotroski F-Score to enhance investment strategies and identify stocks with an improving fundamental outlook, hopefully enabling you to uncover some hidden gems in the process. Whether you are a value investor seeking to uncover undervalued stocks with strong recovery potential or a growth investor aiming to identify companies with sustainable growth trajectories and improving efficiencies, the Piotroski F-Score can be an invaluable tool. By incorporating the Piotroski F-Score into your investment toolkit, you will be able to make more informed investment decisions and potentially help you beat the market.
Historical performance of the F-Score
When Professor Piotroski tested the F-Score over a 20-year period from 1976 to 1996, the results far exceeded his most optimistic expectations. By focusing on companies that scored the highest on his nine-point scale (an F-Score of 8 or 9), investors could achieve an average yearly outperformance of 13.4% over the market. This substantial outperformance demonstrates the F-Score's effectiveness in identifying high-quality stocks with strong financial health.
The strategy's impressive results extended beyond simply buying high F-Score companies. When investors combined buying companies with the highest F-Scores (8 or 9) and shorting those with the lowest F-Scores (0 or 1), the strategy yielded even more remarkable returns. Over the same 20-year period, this approach resulted in an average yearly return that outperformed the market by 23.0%. This highlights the F-Score's ability not only to identify strong performers but also to effectively pinpoint companies likely to underperform, providing opportunities for both long and short investment strategies.
Avoiding low F-Score companies (those scoring between 0 and 3) has proven to be a prudent strategy as well. These companies substantially underperformed the market, with annual returns ranging from -9.1% to -13.2% over the 20-year period. This significant underperformance underscores the importance of steering clear of financially weak companies to protect portfolio returns.
A Societe Generale equity research team, led by top-rated quant analyst Andrew Lapthorne, also conducted extensive research into the F-Score's effectiveness. Their findings confirmed that, independently of valuation, higher F-Score stocks tend to deliver greater returns. Lapthorne's research demonstrates that in the US, Europe, and the UK, high F-Score stocks outperformed the market in four out of every five years.
Moreover, the F-Score also proved to be a valuable tool for short sellers. Piotroski found that stocks scoring two points or less were five times more likely to go bankrupt or delist due to financial problems. This insight has been corroborated by Societe Generale's research, which shows that low F-Score stocks dramatically underperform.

Of particular note was that the F-Score also demonstrated remarkable resilience during bear markets. For instance, in 2008, one of the worst years on record for stocks, most investors experienced dramatic losses across their portfolios. However, the American Association of Individual Investors (AAII) found that their model of Piotroski’s low Price to Book strategy, which includes the F-Score, was the only strategy to post positive absolute returns that year. This impressive performance indicates that high F-Score stocks can serve as excellent protectors during bear markets, providing stability and positive returns even in adverse conditions.
Understanding the Piotroski F-Score
The Piotroski F-Score is a robust framework consisting of nine accounting-based criteria that evaluate a company's financial strength. These criteria are divided into three main categories: profitability signals, leverage, liquidity, the source of funds, and then operating efficiency. By analysing these key financial metrics over time, the F-Score provides insights into the trend of a company's fundamental health and reveals the underlying strength or weakness in its operations.
Profitability Signals
The first set of criteria in the F-Score focuses on profitability, assessing a company's ability to generate profits and cash flow. These checks include evaluating net income, operating cash flow, return on assets (ROA) and the quality of earnings. A company that consistently reports positive net income and cash flow, along with improving ROA and quality of earnings, demonstrates strong profitability signals, indicating its potential for sustained earnings growth over time. Each of these components offers unique insights into different aspects of a company's financial health.
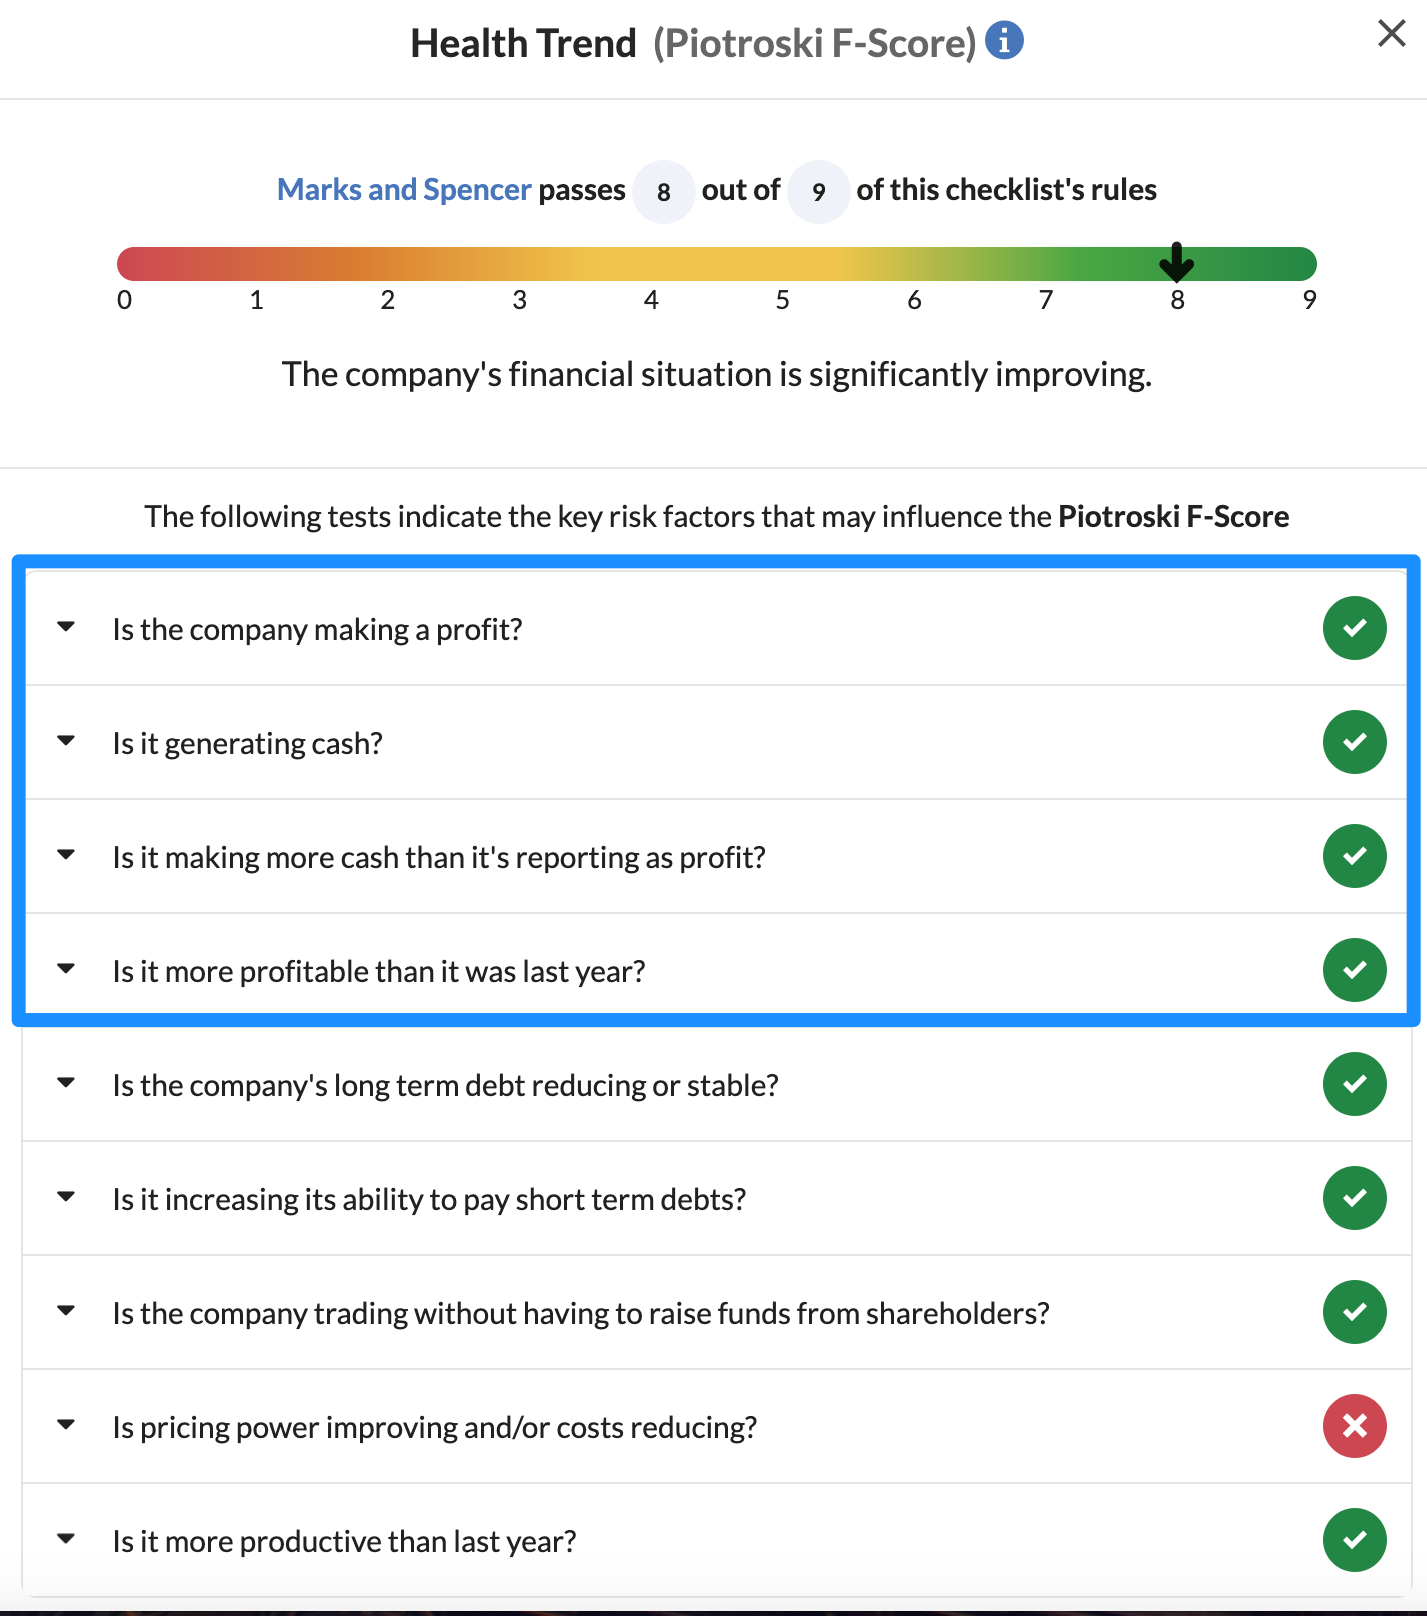
Net income is the profit a company has left over after all its expenses, including taxes and interest, have been subtracted from total revenue. A company scores a point if it reports positive net income in the current year. Positive net income indicates that the company is profitable and has a viable business model. It reflects the company’s ability to cover its costs and still generate earnings, which is essential for long-term sustainability. Unlike net income, which can be affected by non-cash items such as depreciation and amortisation, operating cash flow reflects the actual cash generated by a company's core operations. This metric is crucial because it shows whether a company can generate enough cash to maintain and grow its operations. A positive operating cash flow in the current year earns a company another point on the F-Score, indicating that its core business activities are financially viable and capable of supporting future growth.
It is often considered a more reliable indicator of financial health than net income, which can be influenced by non-cash items and other innovative accounting techniques. Richard Branson, the business magnate and founder of Virgin Group, emphasises the importance of focusing on cash flows rather than earnings: “Never take your eyes off the cash flow because it’s the lifeblood of business.”
Return on assets (ROA) is a financial ratio that indicates how profitable a company is relative to its total assets. For example, if a company generates profits of £1m and has £5m of assets at the beginning of the year, the ROA is calculated as 20%. A company scores a point if the ROA in the current period is higher than in the previous year. An improving ROA suggests that the company is becoming more efficient at using its assets to generate earnings. This trend is a positive signal of operational effectiveness and management efficiency. The quality of earnings measures the extent to which net income is derived from core business operations. It is evaluated by comparing operating cash flow to net income before extraordinary items. A company scores a point if its cash flow from operations exceeds net income before extraordinary items. Higher quality of earnings implies that the company's earnings are sustainable and less likely to be affected by accounting manipulations or one-time events. It shows that the company's profits are backed by actual cash flow, enhancing the reliability of reported earnings and giving more options to management to re-invest in the business, pay down debts or redistribute to shareholders.
By focusing on these profitability metrics, the F-Score can help investors identify companies with robust and improving financial health, which are likely to deliver superior performance in the long run.
Leverage, Liquidity, and Source of Funds
The second set of criteria in the Piotroski F-Score examines a company's capital structure, liquidity position, and sources of funds. These checks include analysing the decrease in leverage, increase in liquidity, and absence of dilution. This section specifically scrutinises whether the company is effectively managing its debt obligations and financing operations without having to resort to shareholder dilution. A company with a stable or decreasing long-term debt, improving liquidity ratios, and no recent equity issuances points to a sound financial position and prudent capital management.
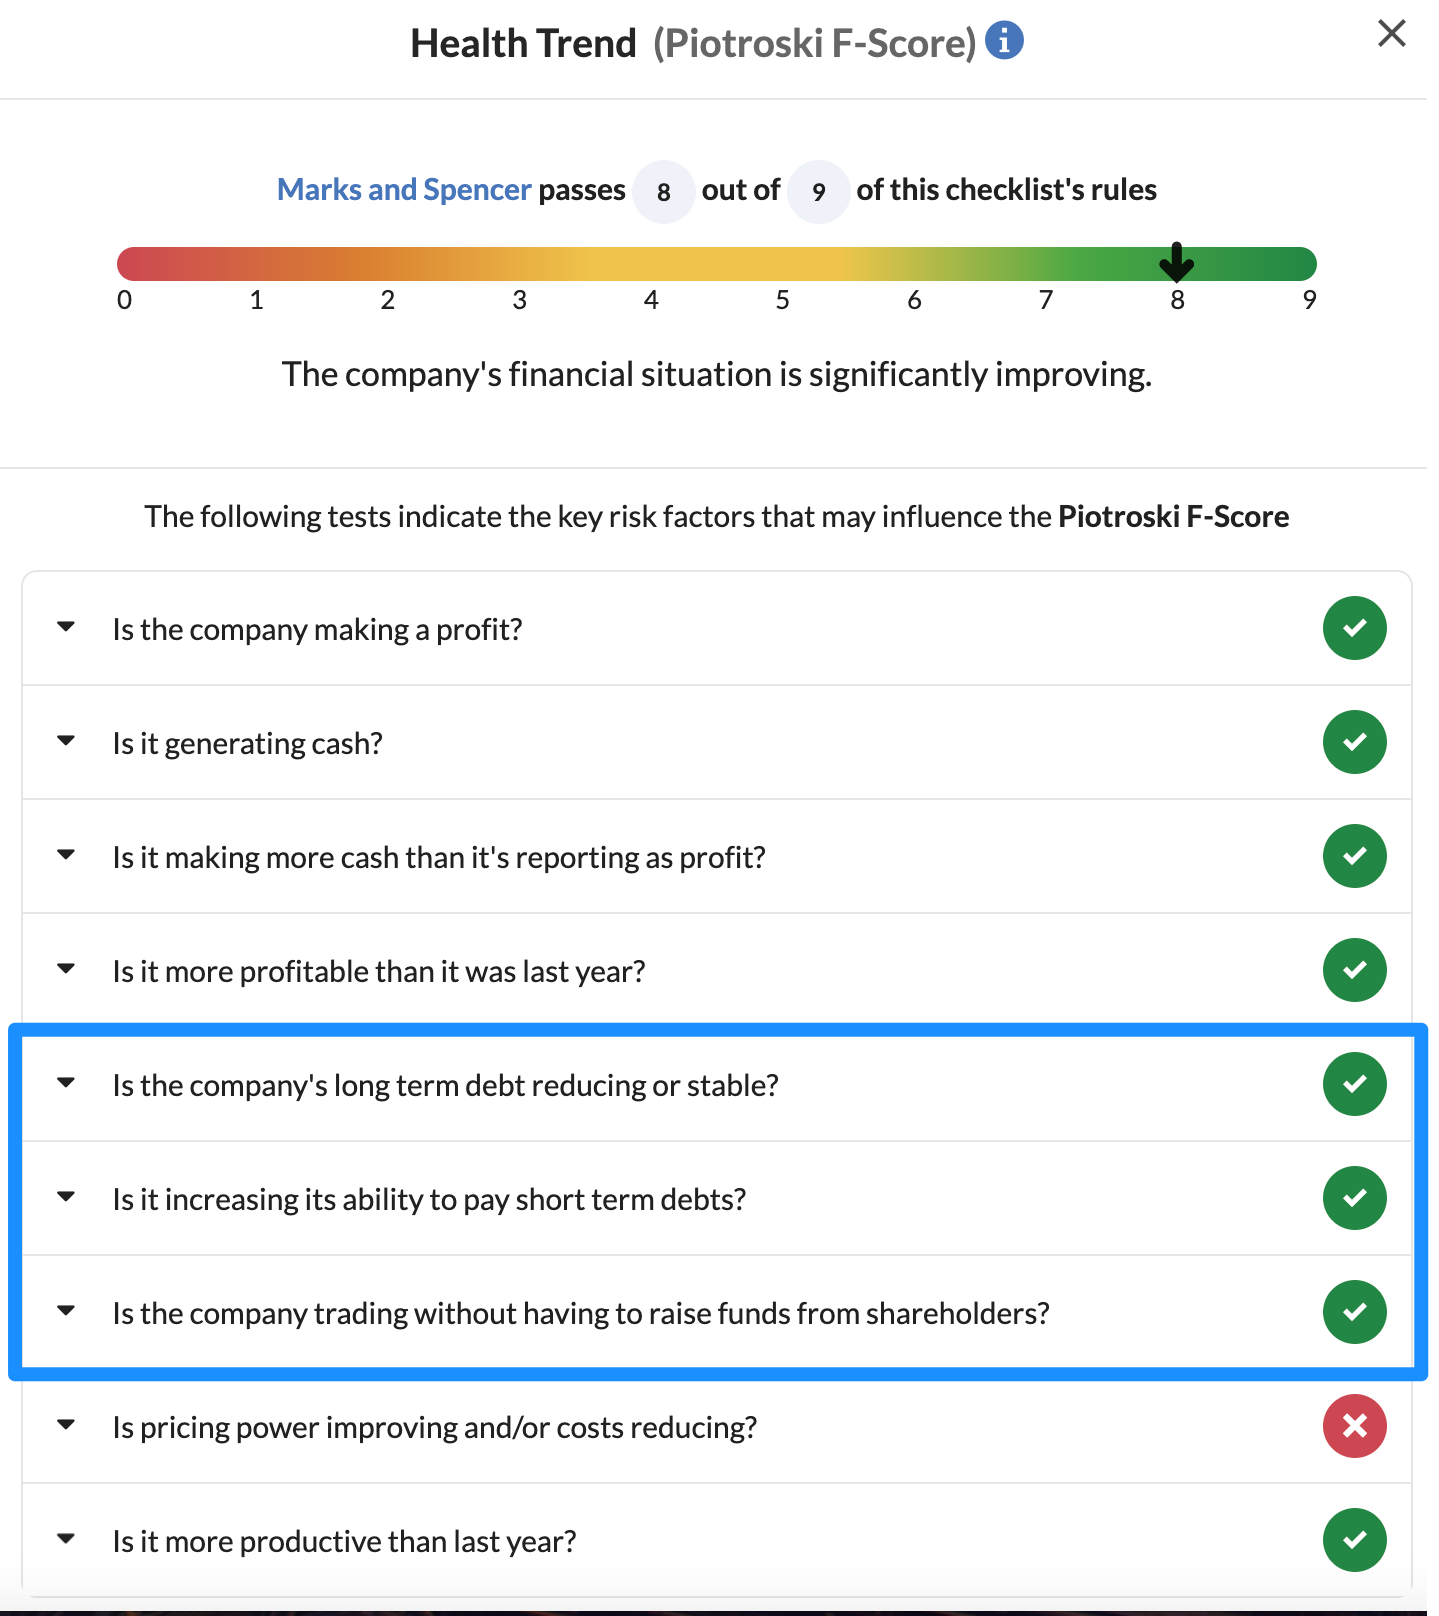
The first thing the F-Score looks for here is a decrease in leverage. That means that a company will earn a point if its long-term debt-to-average assets ratio has decreased compared to the previous year. This ratio is calculated by dividing long-term debt by average total assets. A decreasing ratio indicates that the company is reducing its reliance on debt financing, which reduces financial risk and improves financial flexibility. High leverage, indicated by a high long-term debt-to-average assets ratio, can suggest a high level of risk, as it implies the company may struggle to meet its debt obligations. An inability to meet debt obligations can eventually lead to bankruptcy filings. By reducing leverage, a company demonstrates improved financial health and a lower risk profile.
The current ratio measures a company’s ability to pay its short-term liabilities with its short-term assets. It is calculated by dividing total current assets by total current liabilities. A company will score an additional F-Score point if its current ratio has increased from the previous year. An increasing current ratio indicates that the company is improving its liquidity position, which enhances its ability to meet short-term obligations. Investors typically look for a current ratio of at least 1.5, as a ratio below 1 indicates that a company might struggle to cover its short-term liabilities.
The source of funds element looks at if a has issued new equity or not in the past year. Equity issuances can dilute existing shareholders' ownership and often signal that the company may be in need of cash, potentially due to financial distress or to fund growth initiatives that may not generate immediate returns. By avoiding equity dilution, a company indicates that it is managing its capital needs efficiently without diluting shareholder value. This is a sign of prudent capital management and financial health, forming another key component of the F-Score.
Operating Efficiency
The final set of criteria assesses the operating efficiency of a company, focusing on its ability to generate profits from its assets and operations. This involves evaluating key metrics such as the gross profit margin and asset turnover ratio, which indicate whether the company is becoming more efficient in utilising its resources to generate revenues.
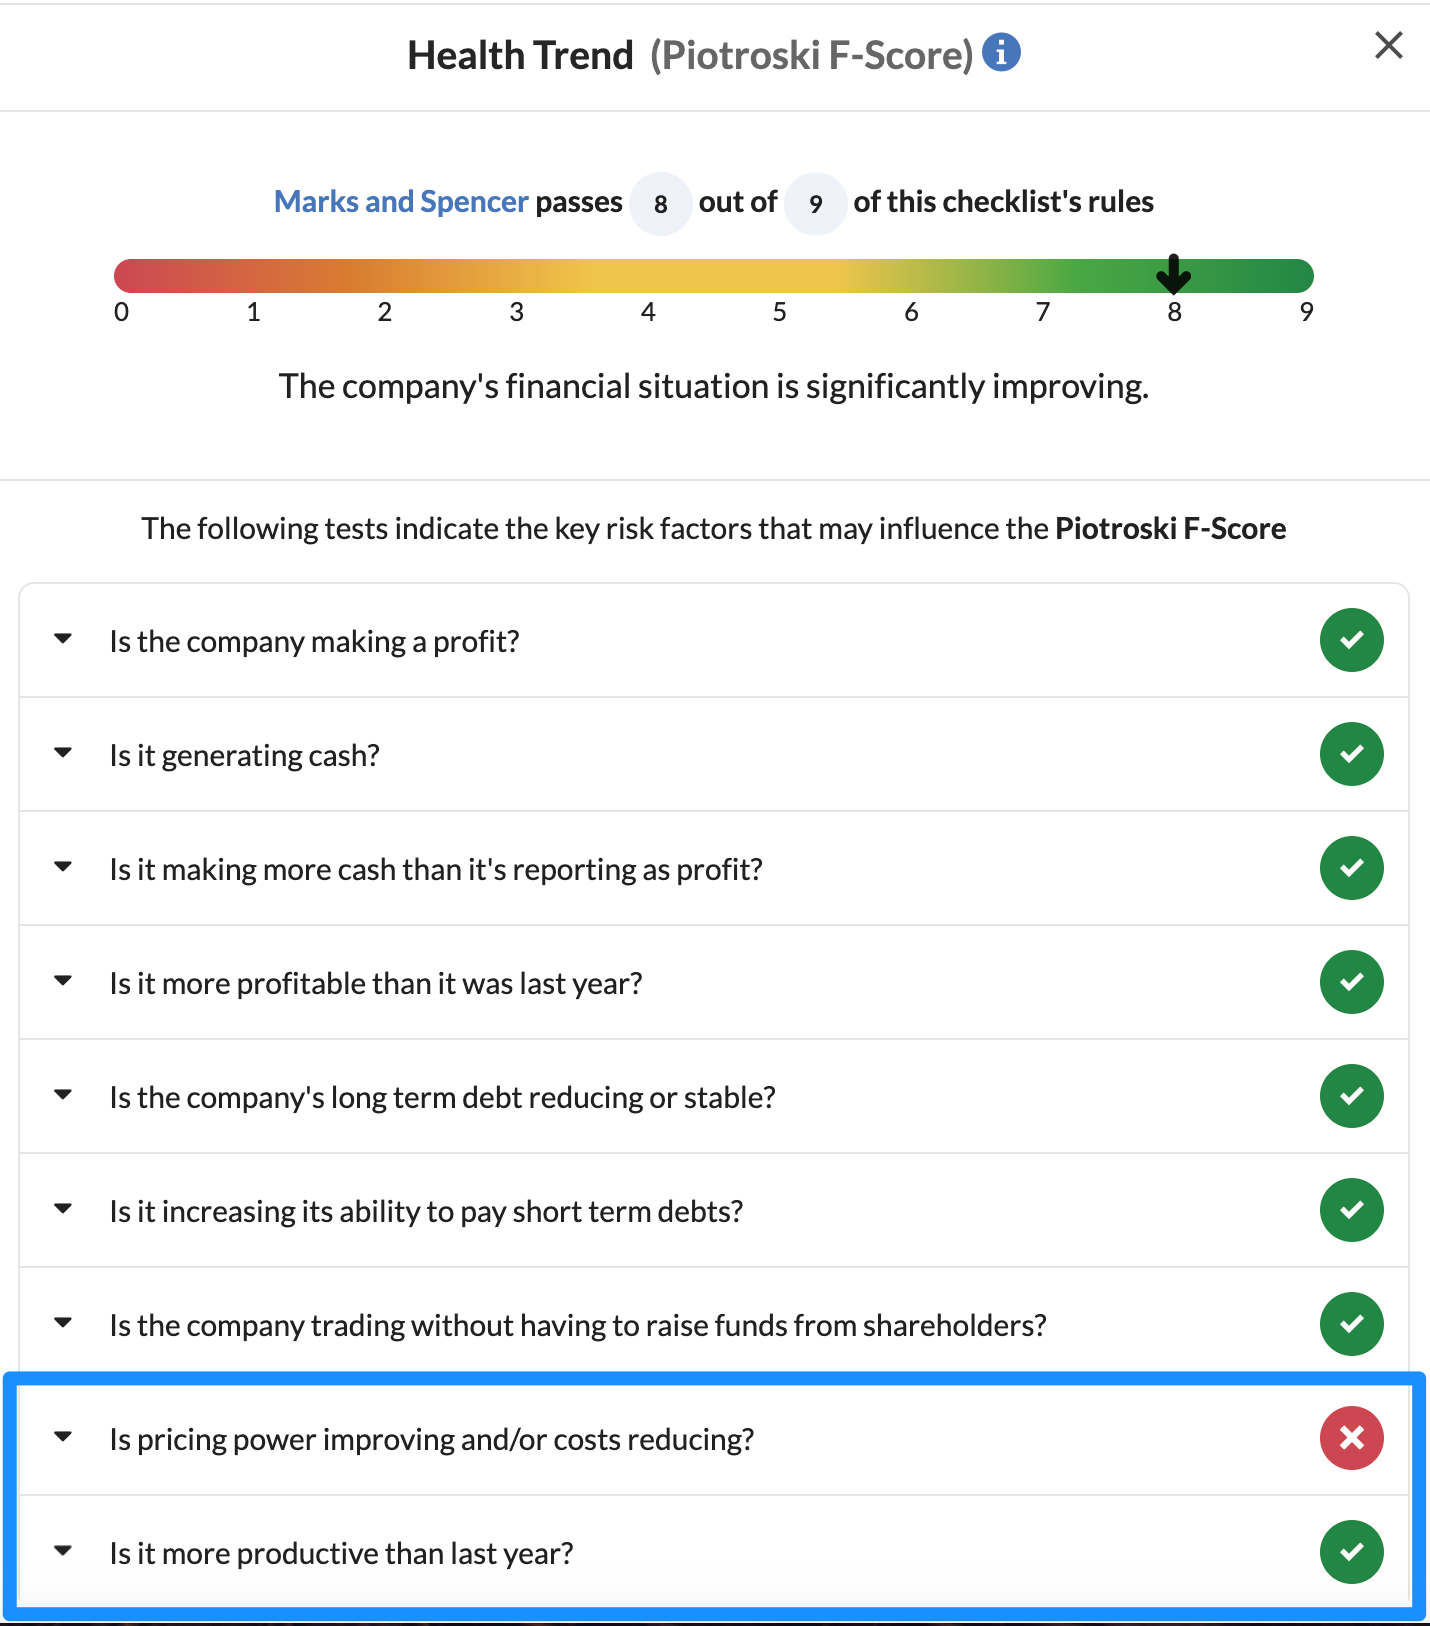
The F-Score looks at pricing power by assessing the gross profit margins. This reveals how much income a company retains after covering all direct production expenses. It is calculated by dividing gross profit by revenue and is typically available for industrial and utility companies on a trailing twelve months (TTM) basis. Specifically, the gross margin is derived by subtracting the annual cost of goods sold from annual total revenue, then dividing the result by annual total revenue and multiplying by 100. This metric provides a fundamental indication of profitability, with higher gross margins suggesting that a company has more funds available to invest in other business operations, such as research and development or marketing activities. If the gross profit margin is improving year on year, then this is another F-Score component ticked off.
As previously discussed, the asset turnover or return on assets is key in determining company productivity. By comparing this year’s productivity levels to the prior year, you can see if the productivity, or the ability to extract more value out of the company’s assets, is increasing. This is the final check of the 9-point F-Score.
A company showing consistent improvement in gross profit margin and asset turnover ratio suggests operational excellence and potential competitive advantages within its industry.
Application of the Piotroski F-Score
Investors can leverage the Piotroski F-Score in various ways to enhance their investment strategies and uncover quality investment opportunities:
Quality Screening
One of the primary applications of the F-Score is to screen for high-quality stocks within a broader universe of companies. By applying the nine criteria of the F-Score to potential investment candidates, investors can identify companies with strong fundamentals and a higher likelihood of delivering superior returns over time. Stocks that score high on the F-Scale, typically eight or nine points, are considered strong candidates for further analysis and investment consideration.
Value Investing
While the F-Score was initially developed as a tool for assessing value stocks, its application extends beyond value investing strategies. Value investors can use the F-Score to distinguish between undervalued companies with strong fundamentals and those with deteriorating financial health. By focusing on undervalued stocks that also score high on the F-Score, investors can identify potentially lucrative investment opportunities that offer both value and quality.
Contrarian Picks
Contrarian investors, who seek to capitalise on market mispricing and investor sentiment, can benefit from the F-Score's contrarian nature. Companies that score low on the F-Score due to temporary setbacks or negative market sentiment may present attractive buying opportunities for contrarian investors. By identifying companies with temporary challenges but strong underlying fundamentals, contrarian investors can capitalise on market inefficiencies and generate outsized returns when sentiment improves.
Risk Management
In addition to identifying quality investment opportunities, the F-Score can also serve as a risk management tool for investors. Companies that score low on the F-Score due to deteriorating financial health or poor fundamental trends may pose higher risks to investors. By avoiding or minimising exposure to low-scoring companies, investors can mitigate the risk of investment losses and preserve capital during turbulent market conditions.
Case Studies
To illustrate the practical application of the Piotroski F-Score, let's consider a few case studies showcasing how investors can use the F-Score to uncover quality investment opportunities: Case Study 1: EasyJet vs Jet2.com Jet2.com and EasyJet are both prominent players in the UK low-budget airline industry. While EasyJet is the larger of the two, ostensibly benefiting from better economies of scale, this has not translated into superior performance. In May 2023, Jet2 scored a near-perfect 8/9 on the Piotroski F-Score, signaling exceptional financial health and strong fundamentals. In contrast, EasyJet garnered a respectable but lower F-Score of 6/9.
A deeper analysis reveals the factors contributing to these scores. Jet2's high F-Score can be attributed to consistent improvements in profitability, effective leverage management, and enhanced operating efficiency. These improvements are indicative of a company that is strategically managing its resources and positioning itself for long-term growth. Jet2's ability to generate profits, reduce debt reliance, and optimise operational performance has established it as a robust competitor in the airline industry.

On the other hand, EasyJet, despite its larger size, has struggled with operational inefficiencies. These challenges have hindered its ability to maximize the benefits typically associated with economies of scale. Issues such as fluctuating profitability, higher leverage, and less effective asset utilisation have contributed to EasyJet's relatively lower F-Score. These factors suggest that EasyJet had been facing hurdles in its efforts to enhance its financial health and operational effectiveness.
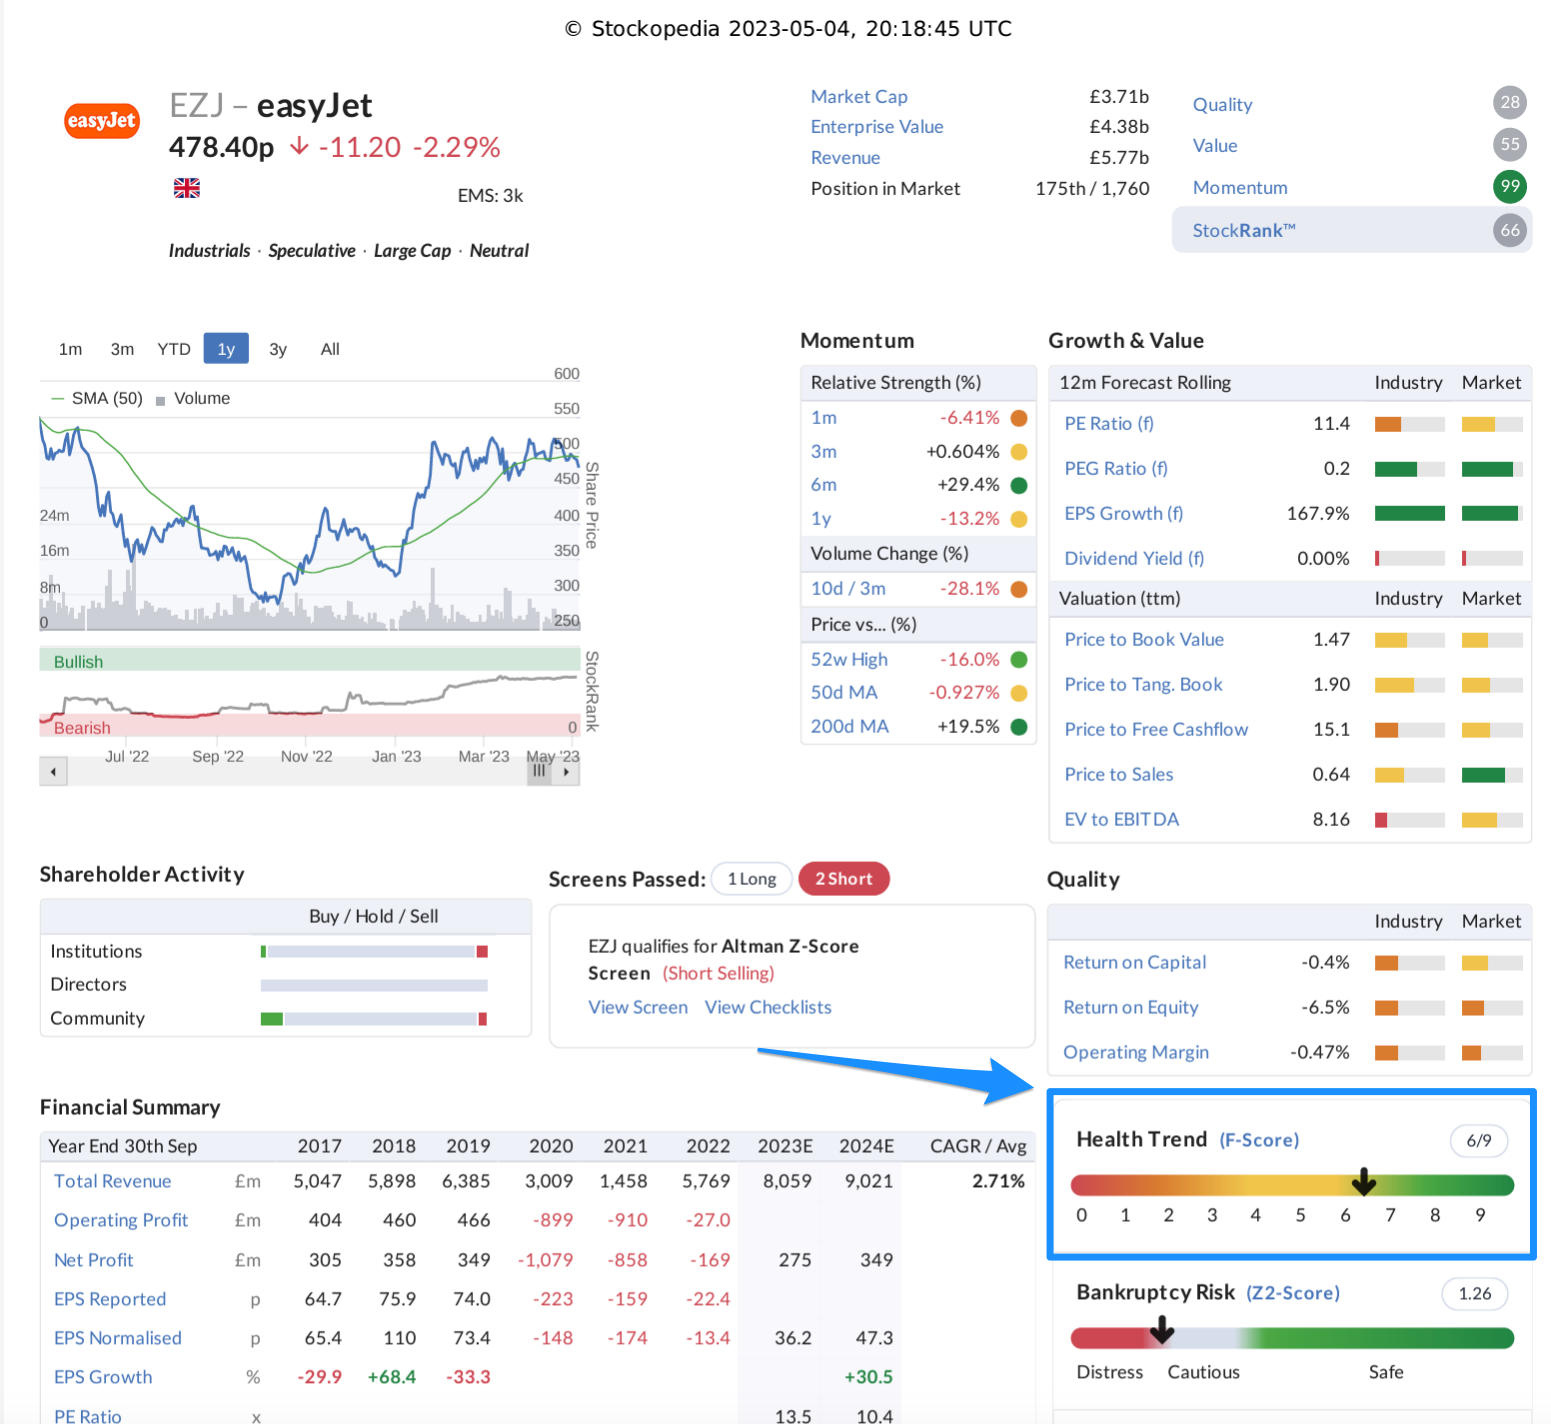
If investors had diligently decided to allocate their funds towards Jet2, rather than EasyJet, they would have achieved returns of 17.5% over the next 12 months. EasyJet holders would have seen the value of their shares fall by 5% over the same period.
The contrast between Jet2 and EasyJet underscores the importance of looking beyond company size when making investment decisions. While larger companies like EasyJet might be expected to perform better due to economies of scale, this is not always the case. Financial metrics and fundamental analysis, such as the F-Score, provide a clearer picture of a company's true financial health and operational efficiency. For Jet2, these metrics have painted a compelling picture of a well-managed, financially sound company poised for continued success.
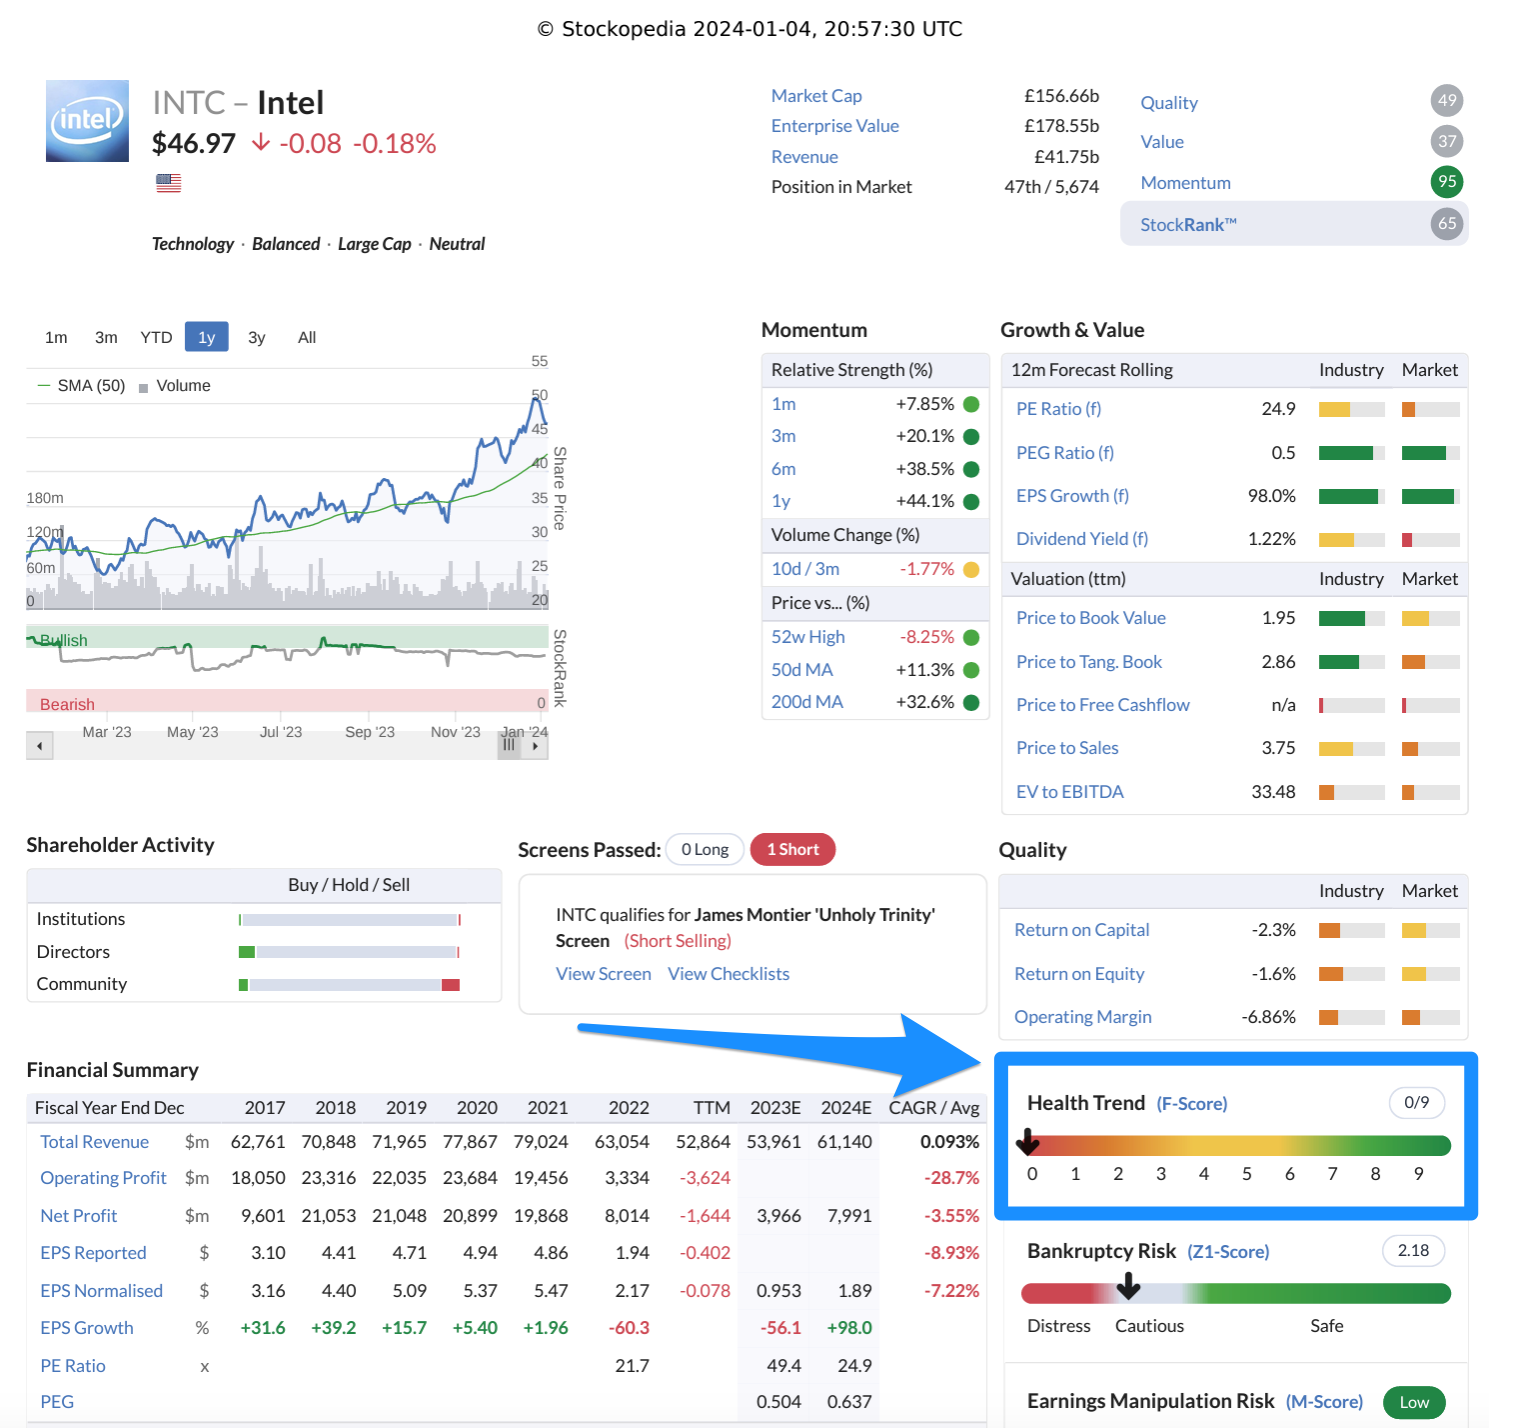
Case Study 2: Intel vs Nvidia A compelling comparison of chip manufacturing giants Intel and Nvidia in the first half of 2024 perhaps even more vividly illustrates the impact of investing in companies with improving profitability, liquidity and efficiency metrics.
Intel has faced significant challenges in recent years, particularly in operational efficiency and technological adoption. A major issue has been its delayed transition to extreme ultraviolet (EUV) lithography, a critical technology for producing advanced semiconductor nodes. This hesitation and subsequent delays have placed Intel at a competitive disadvantage, as it struggled to keep pace with its rivals. Additionally, Intel's Data Center GPU segment has grown more slowly than expected due to product delivery delays and slower ramp-up times. Given the rapid expansion of the data centre market, these setbacks have severely impacted Intel's market position and financial performance (including substantial losses). Moreover, Intel's late entry into the AI chip market has compounded its difficulties. Competitors like Nvidia and AMD have already secured strong positions in this sector, capitalising on the surging demand for AI-driven technologies. Intel's delayed engagement has hindered its ability to capture market share in this crucial area.
As a result of these challenges, Intel began 2024 with a dismal Piotroski F-Score of 0/9, reflecting its poor financial health and operational struggles.
In stark contrast, Nvidia has experienced extraordinary success, becoming one of the top three most valuable companies globally and achieving a stock market valuation higher than the entire German stock market at its all-time-highs. Nvidia's achievements highlight a strategic blend of technological innovation, visionary leadership, and market foresight.
Nvidia's pioneering development of the Graphics Processing Unit (GPU) was initially aimed at enhancing gaming graphics. However, the company repurposed GPU architecture for general-purpose computing (GPGPU), significantly expanding its applications. This led to the creation of the Compute Unified Device Architecture (CUDA), a parallel computing platform pivotal in accelerating various computing tasks, including AI and deep learning. This innovation directly relates to the F-Score's focus on operating efficiency and gross margin improvement, as Nvidia's advanced technology enabled it to increase profitability and operational efficiency.
As AI technology surged, Nvidia leveraged its expertise to dominate the AI hardware market. Its GPUs became essential for training AI models, particularly deep learning networks, due to their efficiency in handling massive parallel processing tasks. Nvidia's data centre revenue soared as its hardware became integral to tech giants like Amazon, Google, and Microsoft, as well as numerous AI startups. This surge in revenue growth is a testament to Nvidia's strong asset turnover ratio, another key criterion of the F-Score, indicating efficient use of assets to generate sales.
CEO Jensen Huang has played a crucial role in Nvidia's sustained innovation and market relevance. His early recognition of the GPU's potential beyond gaming led to the development of CUDA and Nvidia's subsequent dominance in AI and data centres. This strategic leadership contributed to Nvidia's strong financial health, as evidenced by its high F-Score of 7/9 at the beginning of 2024. Nvidia's robust financial metrics, including 126% revenue growth and 286% net income growth in 2023, reflect its excellence in multiple F-Score criteria.
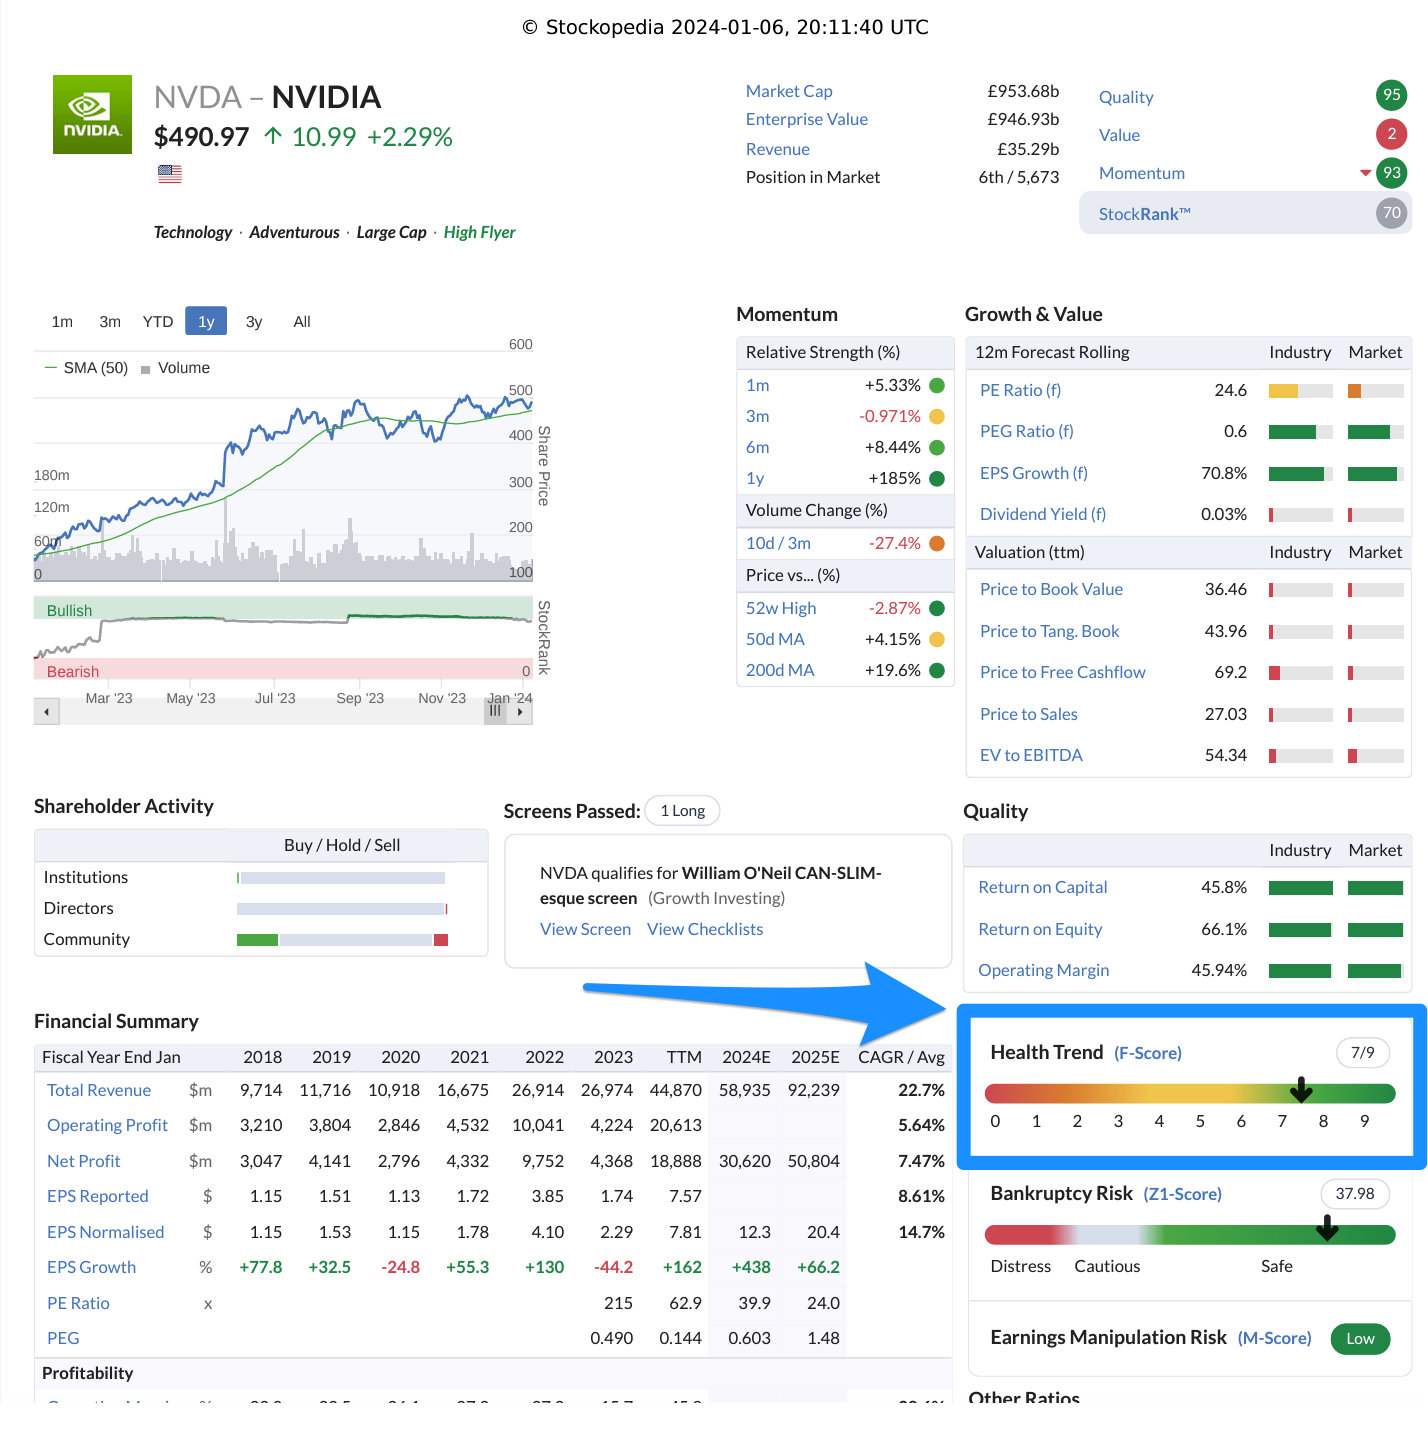
Nvidia's strong fundamentals and high F-Score translated into impressive stock performance, with a nearly 140% increase from January to the end of May 2024. In contrast, Intel's share price plummeted from $47 to just over $30, a 36% drop, highlighting the stark differences in the fortunes of these two semiconductor giants. Investors gravitated towards Nvidia, driven by its robust fundamentals and strategic positioning, while Intel's ongoing struggles and lower F-Score made it less attractive. This case study vividly demonstrates the critical importance of strategic foresight and operational efficiency in achieving market success, as measured by the Piotroski F-Score criteria.
Conclusion
In conclusion, the Piotroski F-Score offers investors a powerful framework for assessing the fundamental health and quality of companies. By analysing key financial metrics and trends, investors can identify high-quality investment opportunities with the potential for superior long-term returns. As Warren Buffett famously said, "Time is the friend of the wonderful company, the enemy of the mediocre." With the Piotroski F-Score as their guide, investors can uncover the wonderful companies poised to thrive and compound wealth over time.