Do large cap IPOs outperform?

Our detailed analysis of IPO performance revealed a counterintuitive yet compelling insight: smaller companies tend to outperform their larger counterparts across multiple timeframes. This finding challenges the traditional investor focus on high-profile, large-cap IPOs and sheds light on opportunities within lesser-known, smaller-cap companies.
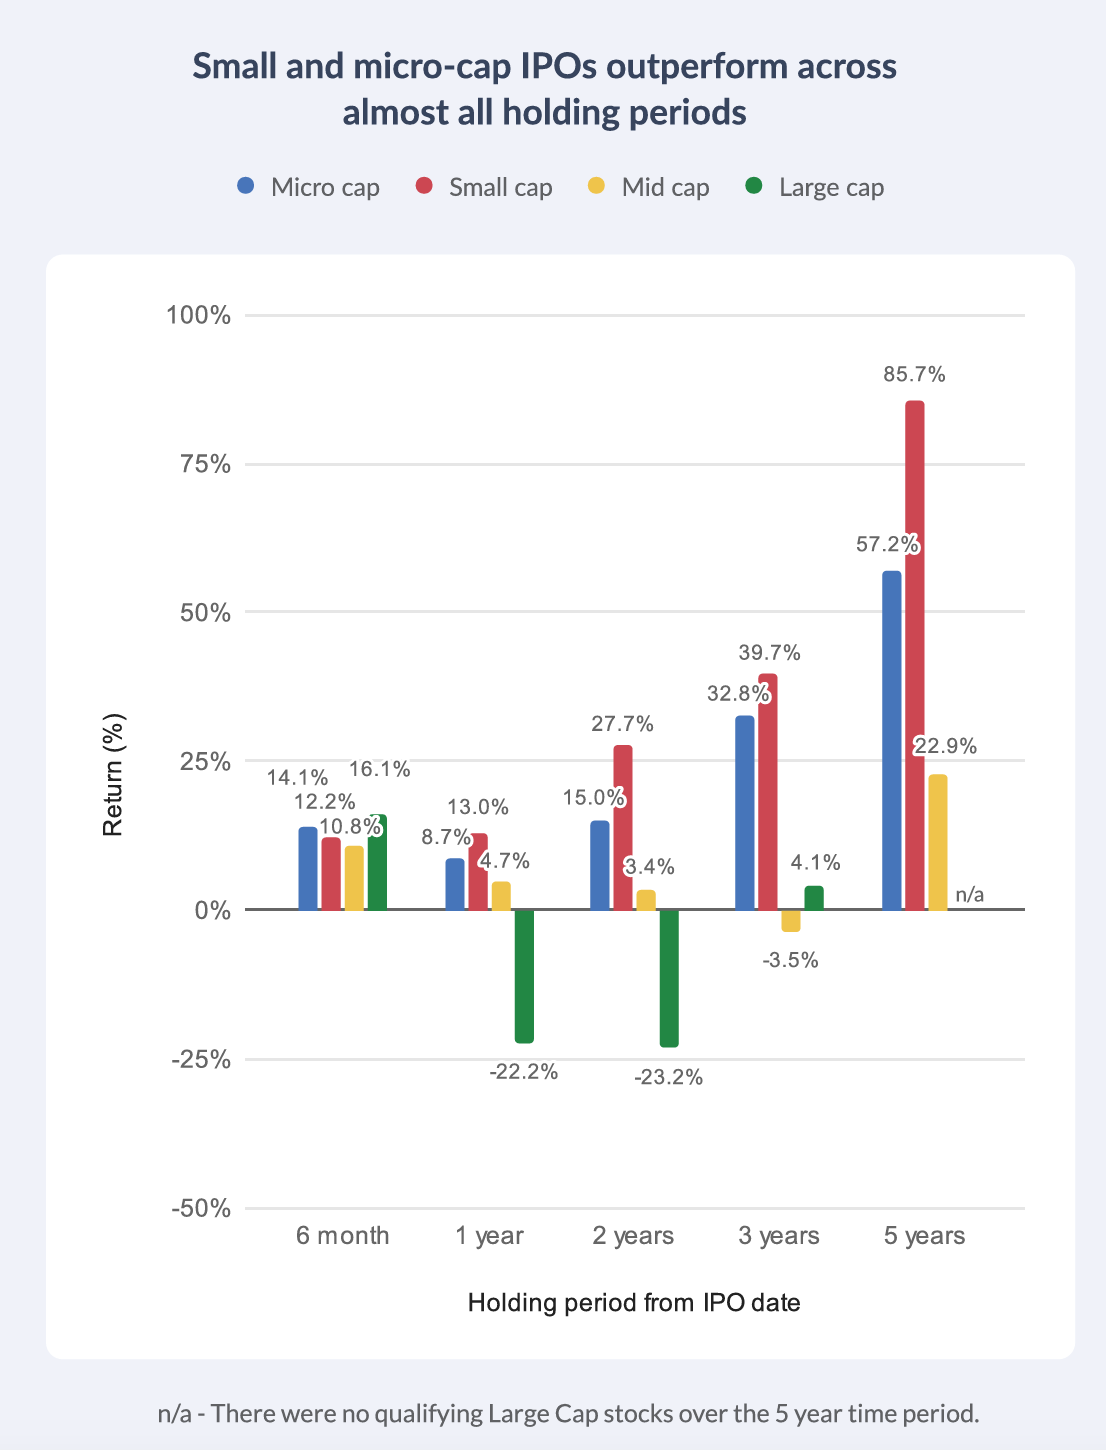
IPO Performance by Market Capitalisation
To understand the dynamics of IPO performance, we categorised companies into four groups based on market capitalisation at the time of their IPO:
Micro-Cap: Less than £50 million
Small-Cap: £50 million - £350 million
Mid-Cap: £350 million - £2.5 billion
Large-Cap: Greater than £2.5 billion
Our research paints a clear picture of how performance varies across these groups.
Micro-Cap: The Short-Term Stars
Micro-cap companies exhibited the best short-term performance. Their relatively small size and volatile nature make them highly responsive to market movements. Even modest trading volumes can cause significant price swings, resulting in sharp gains. For example, within the first six months of listing, micro-caps achieved some of the highest percentage returns in our dataset.
However, this impressive performance is driven by a small subset of companies. Many micro-cap IPOs fail to deliver consistent results or struggle to sustain early momentum. Investors pursuing micro-caps should be mindful of the higher risks associated with these companies, as their success often hinges on niche markets or unproven business models. A lack of liquidity is one of the main things to watch out for in micro-cap IPO opportunities.
Small-Cap: Consistent Long-Term Growth
Small-cap companies were the standout performers over longer timeframes. While they lagged slightly behind micro-caps in the short term, their performance surged after the one-year mark. Over a five-year period, the average small-cap IPO delivered an impressive return of 85%, comfortably outpacing all other market capitalisation groups.
Small-caps often benefit from being under-researched and underappreciated by the broader market. This lack of attention creates opportunities for discerning investors to identify high-potential companies before they gain mainstream recognition. These companies are also better positioned for sustainable growth, as they often have relatively established business models and operate in scalable industries.
Mid-Cap: The Middle Ground
Mid-cap IPOs tended to underperform relative to smaller counterparts. While their larger size provides some stability, they lack the explosive growth potential seen in micro and small-caps. Additionally, mid-caps may face greater scrutiny from analysts and institutional investors, leading to more tempered post-IPO performance.
Large-Cap: A Riskier Bet
Large-cap IPOs were the worst performers in our study, with an average negative return exceeding -20% within the first one to two years of listing. Despite their high visibility and extensive promotional efforts, these companies often struggled to meet inflated market expectations. Aggressive pricing by company advisors, combined with excessive marketing to private investors, frequently led to overly inflated flotation prices.
Moreover, large-cap IPOs are often driven by private equity or venture capital firms seeking to exit their positions. This dynamic creates a situation where sellers are highly motivated, while buyers may face limited upside potential. Conclusion Our analysis highlights a crucial takeaway for investors: bigger isn’t always better when it comes to IPOs. While large-cap listings may dominate headlines, they often underdeliver, weighed down by aggressive valuations and high expectations. In contrast, smaller companies—particularly those in the small-cap space—offer some of the most compelling long-term growth opportunities. These under-the-radar businesses are often overlooked by institutional investors, creating a fertile ground for those willing to do their research.