What are the Stockopedia RiskRatings™


The RiskRatings are Stockopedia’s classification of the market volatility of every company’s share price. We have designed the RiskRatings to be both a useful predictive measure of future volatility, but also an easy to use measure for accessing the “low volatility anomaly” - the unusual fact in equities, that lower volatility securities tend to outperform high volatility securities over the long term.
The five classifications (from least to most volatile) are shown below:
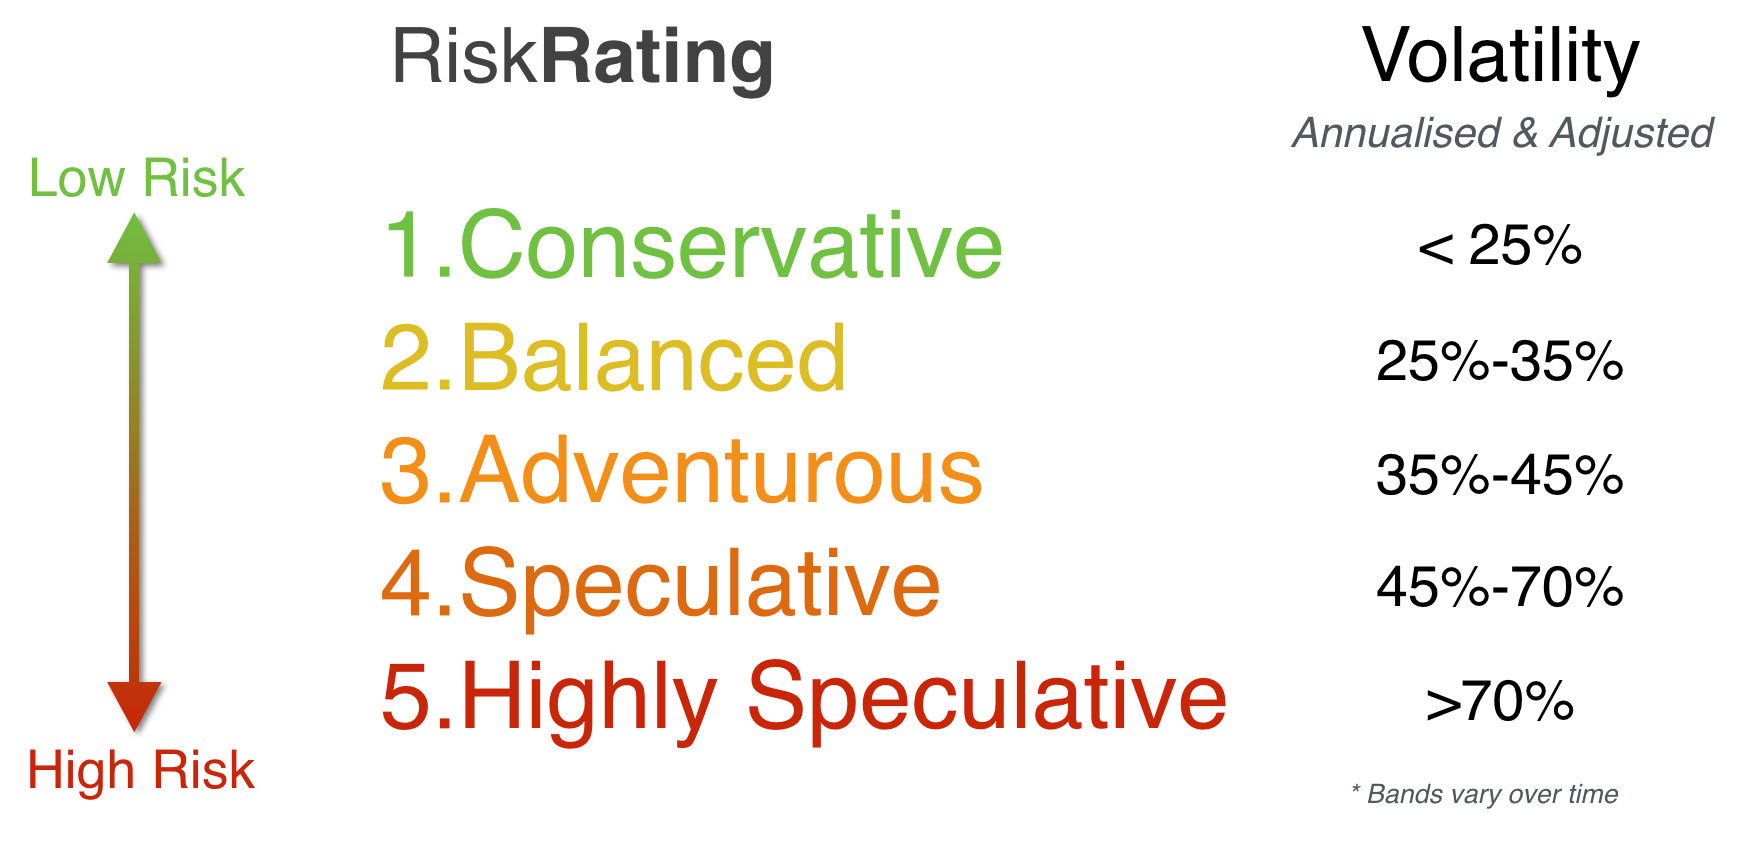
In general, larger, more predictable and more profitable companies tend to be classified as Conservative, while younger, news driven, early revenue companies will be classified as Speculative.
Volatility is the most common measure of risk used in quantitative finance to assess risk adjusted returns. The use of volatility as 'risk' is somewhat controversial, and criticised by many value investors. The common complaint is that "risk is not volatility, it is the likelihood of capital loss".
But modern portfolio theory defines risk as the possibility of upside gain as well as downside loss. While Value Investors have struggled to quantify the likelihood of capital loss, Quantitative Investors have proven that price volatility is one of the best predictors of future upside and downside financial risk.
Understanding RiskRating Distributions
Investors can use the RiskRatings as an at-a-glance measure of a stock’s volatility, but also as a useful portfolio construction and diversification measure for differing market environments. When thinking about the RiskRating of any stock, it’s worth understanding the distribution of RiskRatings across different market segments.
Firstly all the equities in the stock market are split by RiskRating as follows:

These proportions will never change. So the ratings should be understood to be relative. So if the entire market turns highly volatile for an extended period of time, there will still be 10% of the market classified as “Conservative”.
1. The relationship between RiskRating and Size Group
The following graphic analyses the RiskRatings and Size Groups of all Pan-European equities.
There are a few ideas to note:
The number of Conservative and Balanced shares across each size group is fairly similar.
The number of Adventurous shares increases fairly linearly as size decreases from Large to Micro Cap.
The count of Speculative and Highly Speculative shares increases exponentially across smaller size groups.
Proportionally large caps are skewed towards lower RiskRatings, while smaller caps are skewed towards higher RiskRatings. In spite of this, it is still possible to build risk diversified portfolios at all Size Groups.
2. The Relationship between RiskRating and StockRank
If we look through the lens of the StockRank - our proprietary ranking of each stock’s Quality, Value and Momentum - we can see a similar picture.
The lowest ranking sets of shares tend to be far more speculative. Higher ranking shares have a proportion of lower RiskRatings.
If we dig a bit deeper we find a strong negative correlation between price volatility and company quality. The scatter plot below shows that higher Quality Rank stocks tend to have lower volatility share prices.
And digging even deeper, we get an even more interesting relation between a company’s Bankruptcy Risk to Share Price Volatility. Using the Altman Z-Score (available as a bankruptcy meter on all Stock Reports) we can build a scatter plot against Share Price Volatility.
The insight from this chart is that the highest volatility segment of the market is either focused in the highest or the lowest bankruptcy risk segments of the market. It’s clear why high bankruptcy risk stocks should be volatile, but why low bankruptcy risk stocks? The reason is twofold. Firstly a lot of the most speculative investments have binary finances (they are either well financed post-funding or very poorly financed and seeking funding), while a lot of cash generative growth stocks can become very volatile due to investor over-enthusiasm.