Donchian Channels
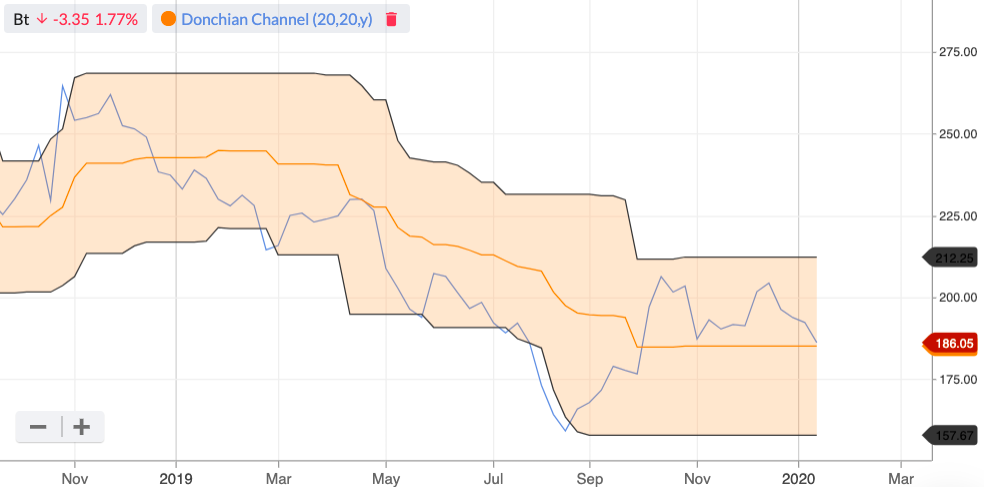
Donchian Channels are a trend following indicator used to plot the highest highs and lowest lows in price over a given period.
The idea is that the indicator offers a view of volatility in price - with the Donchian Channel being wider in periods of high volatility.
The indicator can also guide entry and exit positions because it offers a visual on when a price breaks out above the upper band of the channel and breaks down below the lower band of the channel.
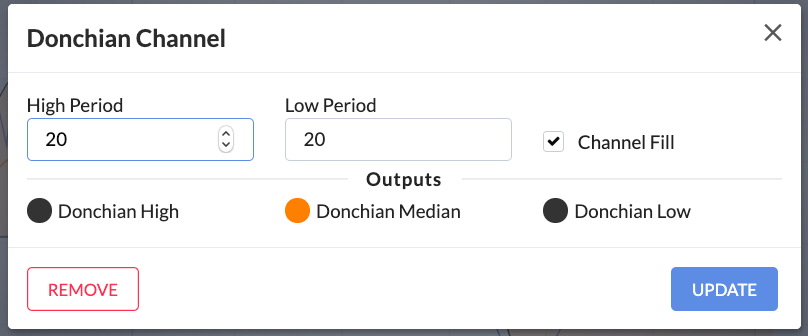
The Donchian Channel settings use the previous 20 days for both the high and low prices. These parameters can be changed in the Donchian Channels settings modal.