Bollinger Bands
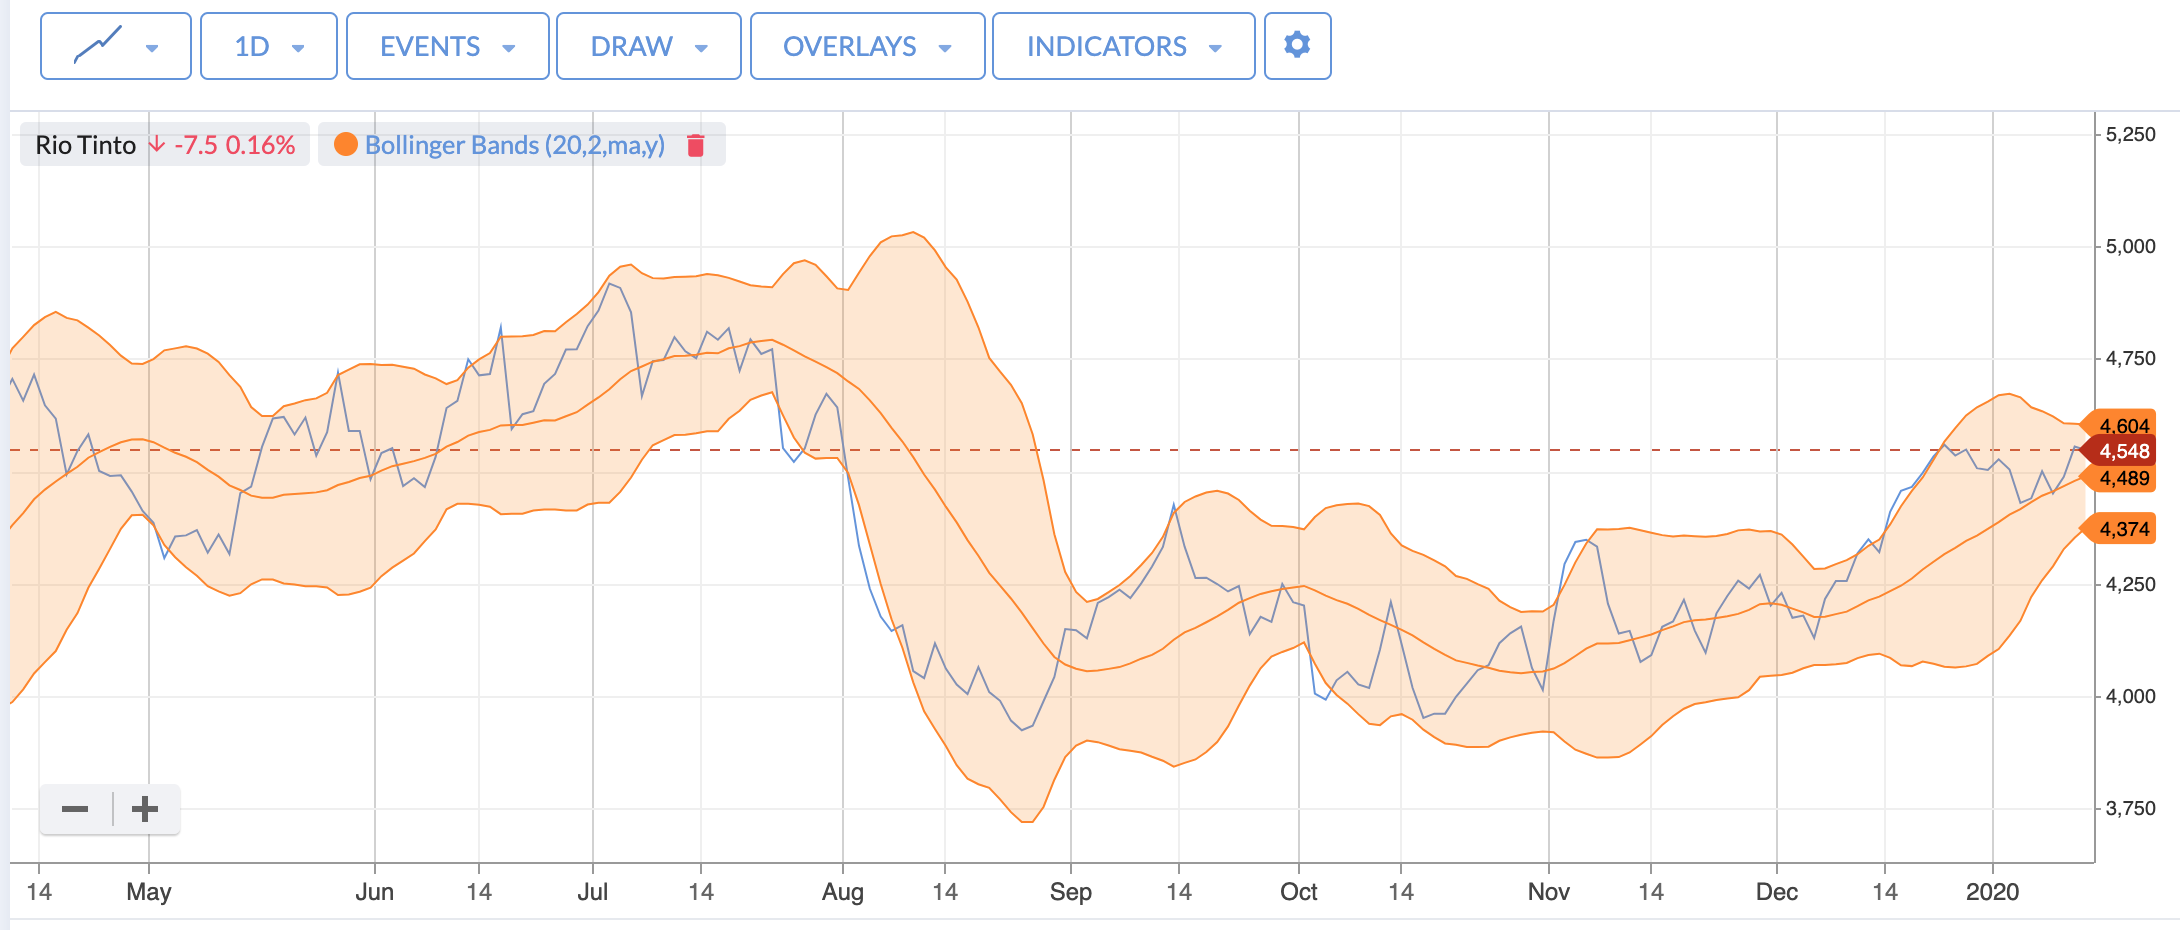
Bollinger Bands are overlay channels that are drawn using a stock’s Moving Average (MA) and the standard deviation from the Moving Average. They consist of three bands, with the following default settings:
- A middle band (plotted using a stock’s 20-day moving average)
- A lower band (plotted 2 standard deviations below the moving average)
- An upper band (app_node_termplotted 2 standard deviations above the moving average)
The lower and upper bands can be used to identify levels of support and resistance in price.
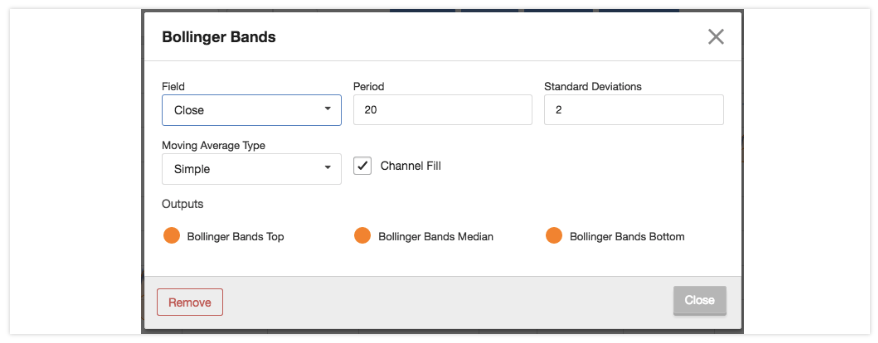
As with all overlays, the Bollinger Bands default settings can be customised. Simply click the Bollinger Bands link at the top right-hand side of the chart. This will open a modal window where you can make your adjustments.