An investor who invested in Games Workshop (LON:GAW) 10 years ago might have paid around 500p per share for their shares.
If they’d held on to those shares, they would have received 420p per share in dividends alone during the company’s 2024 financial year.

Assuming broker forecasts are correct, our lucky long-term investor will receive 471p per share for the 2024/25 financial year. That’s a dividend yield on purchase cost of 94%.
I’d imagine this yield figure could easily reach 100% over the coming years. That would see our model investor receiving the entire cost of their original investment back in cash each year.
That’s not all. Since January 2015, Games Workshop has paid a total of 2,281p per share in dividends. That means these shares have been a dividend multibagger over the last decade, generating a 350% return from income alone.
Alongside this of course, Games Workshop shares have multibagged themselves. More accurately, the stock has been a 28-bagger, delivering a 2,750% profit over 10 years.

How significant is dividend income?
When set against the scale of Games Workshop’s share price gains, the income generated by the stock may first seem like a sideshow.
Indeed, I suspect that many growth-focused investors sometimes see dividends as an incidental. Nice to have, but not really relevant to the investment case.
I can understand the reasons for this. But what if dividend growth was actually an indicator of underlying growth potential, rather than just a symptom?
Alex and I have been doing some research that seems to suggest exactly that. We’ve found that companies that are able to deliver strong, sustainable dividend growth may also be those with above-average growth potential – possible multibaggers.
Here’s a summary of the approach we took:
Alex gathered data on dividend-paying UK shares that have been listed for the last 10 years and ranked them by compound average dividend growth over that time.
We then took the top 30 and bottom 30 stocks in terms of dividend growth and compared them using various fundamentals, both out the outset (2014) and on a 10-year average view (2014-24).
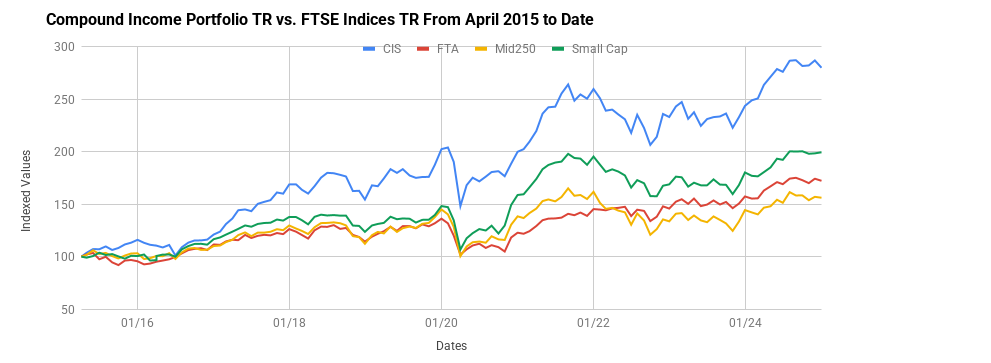
Finally, we compared the total return (share price change plus dividends) from our top…