Last year, I looked at when to sell QM stocks: high-quality winners. I thought it would be interesting to expand the study to look at when to rebalance a portfolio of SuperStocks, the highest-ranked stocks on a combination of Quality, Value and Momentum.
The conclusion I came to for QM investors was that they could generate continued outperformance by holding a portfolio of QM stocks for up to four years:
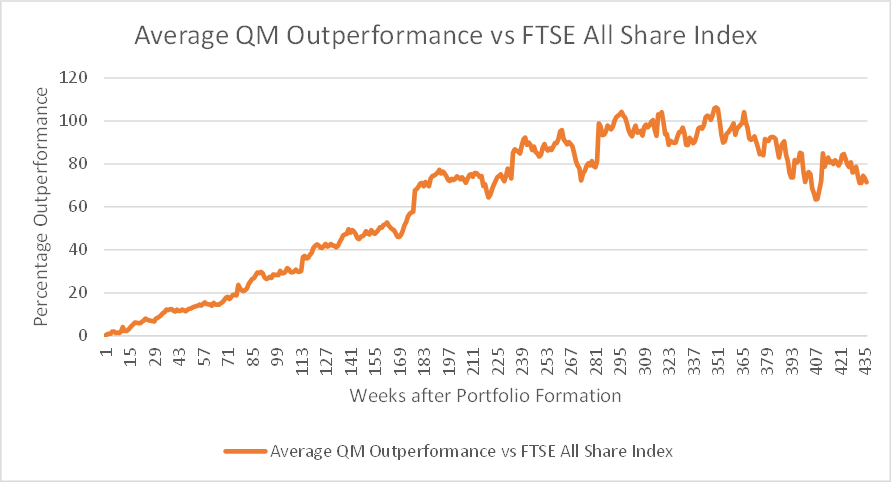
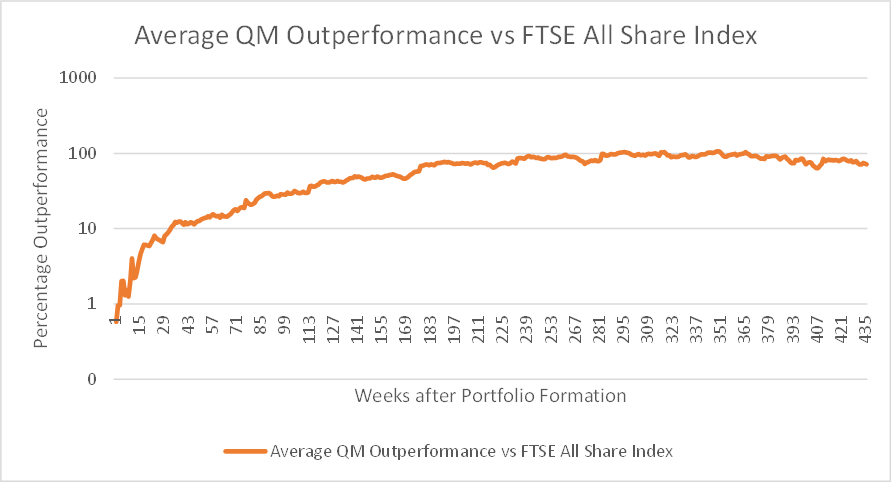
It seems the quality factor continues to drive outperformance even after the initial momentum may have faded. After this period, holding further is likely to lead to underperformance. However, if an investor is interested in maximising compound returns, they should probably sell after a year, as the same graph on a log scale shows more clearly:
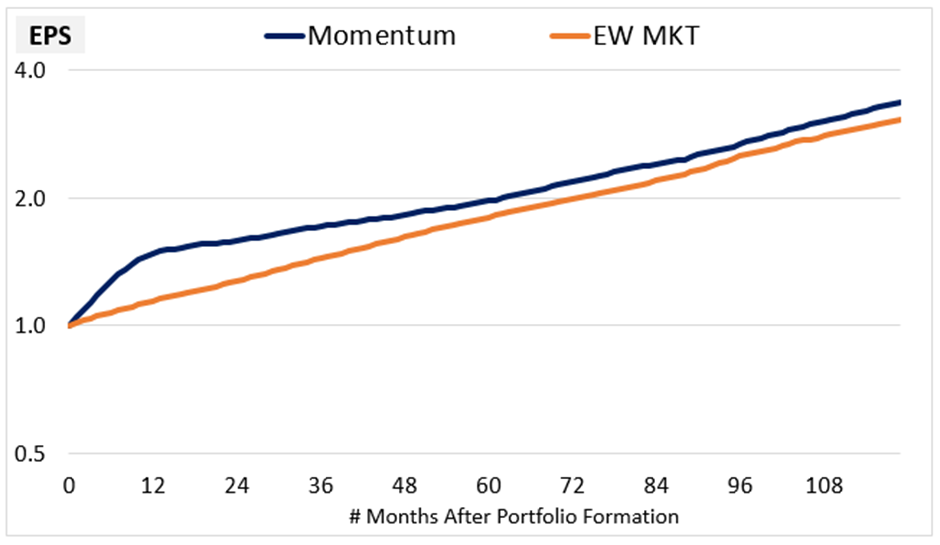
This is due to Momentum being a relatively short-lived phenomenon in terms of EPS outperformance, as the following graph from the Factors From Scratch study shows:
Complicating matters is the challenge that Momentum is one of the best factors to trade in theory and one of the worst in practice. Many quant momentum funds have not lived up to the hype. The reason is likely the high costs of regular rebalancing. So, in this respect, investors may be better off holding for longer periods.
Another factor that may be impacting is that the Quality Rank is heavily weighted to the Piotroski F-Score, which contains earnings Momentum measurements. This makes the Quality and Momentum Ranks positively correlated:
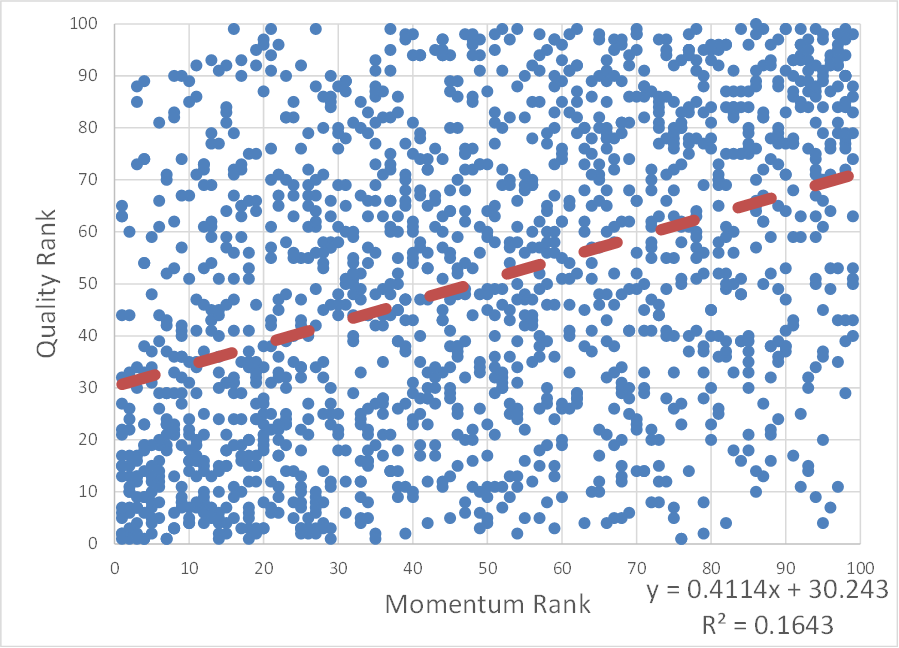
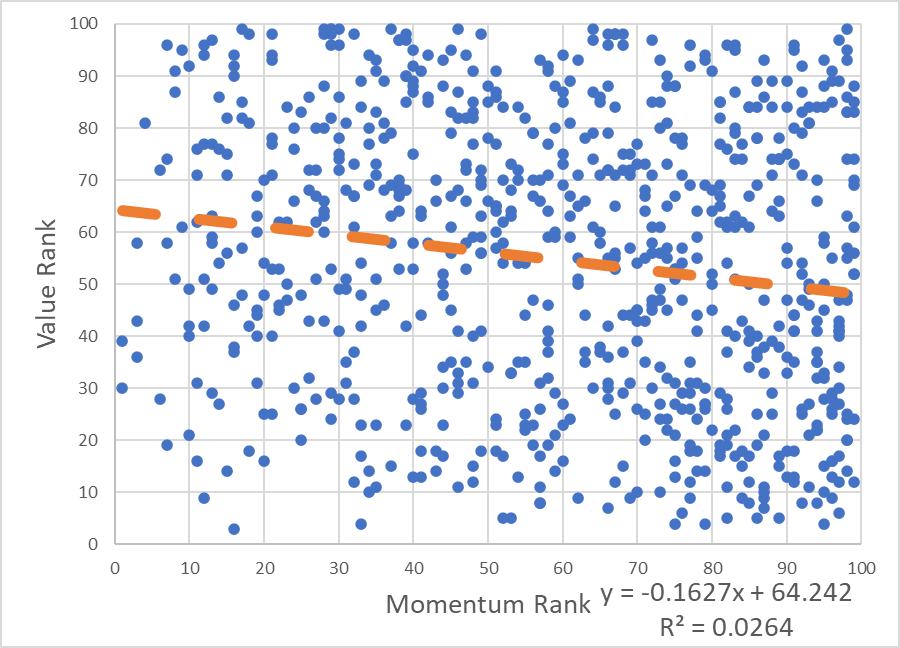
In contrast, Value and Momentum are largely independent and even negatively correlated when only looking at stocks that are forecast to be profitable, as the following plot shows:
Methodology
This time, I started with the data I used to study whether investors should ignore low-margin SuperStocks (Spoiler: they should not). This means I have a list of all of the UK SuperStocks at the end of March for each year, 2014-2023. I then looked at how these stocks performed over subsequent periods. Since the Stockopedia data began in 2014, I couldn’t go any further back, but it means we have one 10-year period, two 9-year periods, …., and ten 1-year…