Breadth indicator discussed: % of Stocks Above Key Moving Averages for 20-day, 50-day & 200-day.
The three charts posted are for the S&P 500 (SPX) vs % of Stocks Above Key Moving Averages mentioned above.
From a breadth standpoint, the market is mean reverting in nature, as can be seen via the charts below (please right click and open in new tab to enlarge).
An important concept is 'the market' oscillates from overbought readings to oversold readings and vice versa (mean reverting).
Why is this usual information? Two main reasons:
(1) A rising tide lifts all boats, and
(2) Swimming against the current is hard!
The way I think about it is when oversold readings occur the market has 'room to run' to the upside. When in overbought territory, it's likely there is little 'running room' left.
Now for some mental complexity, one has to think about rising tides and currents across three different durations being short, intermediate, and long-term.
(1) Short-term: 20-day reading,
(2) Intermediate-term: 50-day reading, and
(3) Long-term: 200-day reading.
Another way to think about the above is how much running room to the upside is likely left across the different durations.
For example, the intermediate and long-term readings might be oversold and about to 'raise all boats', however, the short-term trend is overbought and going to create a current.
Before looking at the charts below it's important to know the overbought and oversold readings, these are:
>75% of stocks above a moving average = overbought (red shading)
<25% of stocks above a moving average = oversold (green shading)
The charts below are lined up for the SPX over the indicator to show what the market did and readings at those times. Focus on tops and bottoms and correlations.
Chart 1: S&P 500 % of Stocks Above 20-Day Moving Average 2022/23
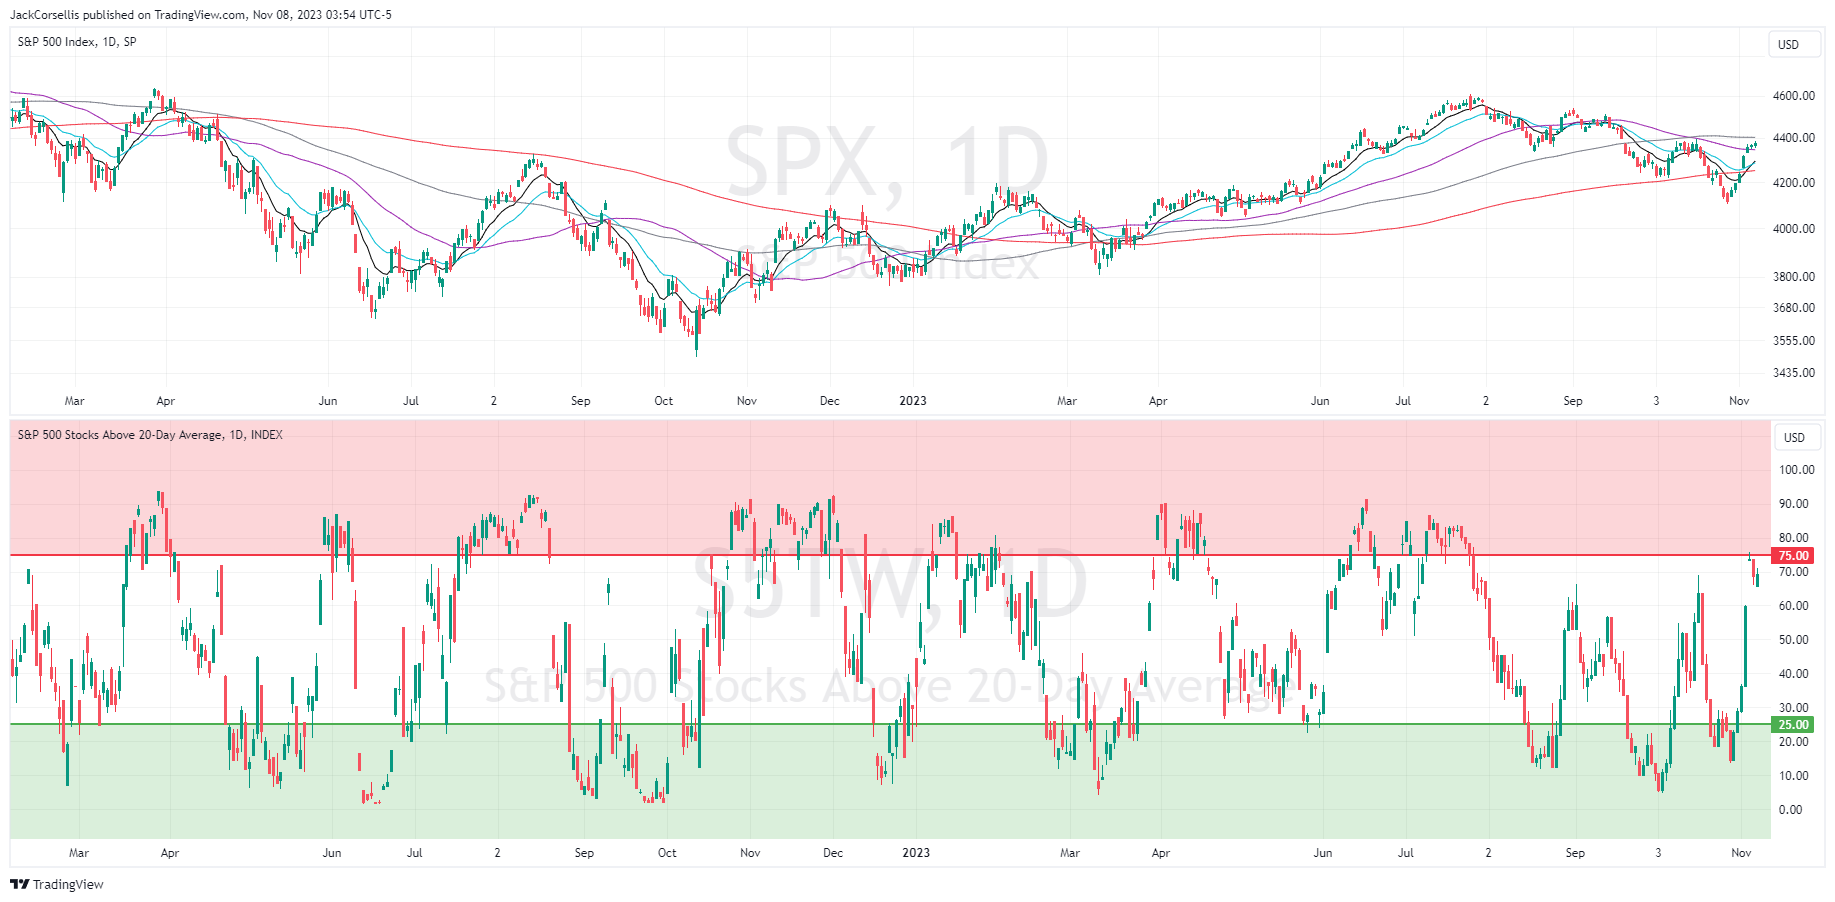
Chart 2: S&P 500 % of Stocks Above 50-Day Moving Average 2022/23
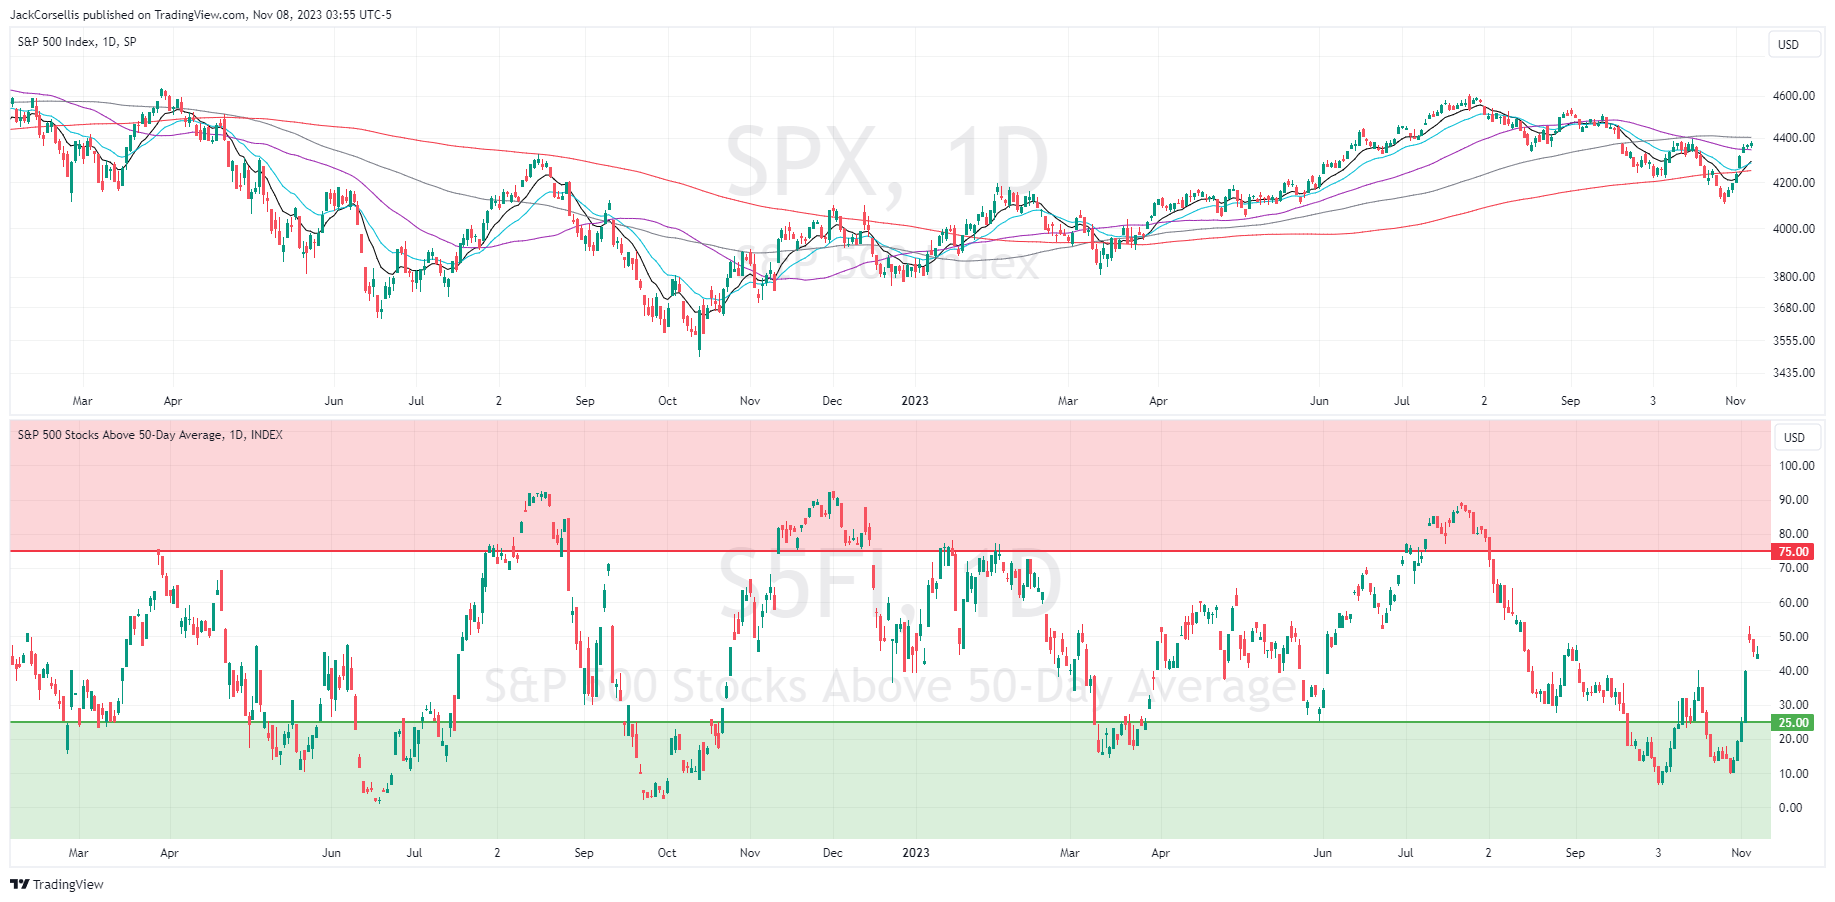
Chart 3: S&P 500 % of Stocks Above 200-Day Moving Average 2022/23
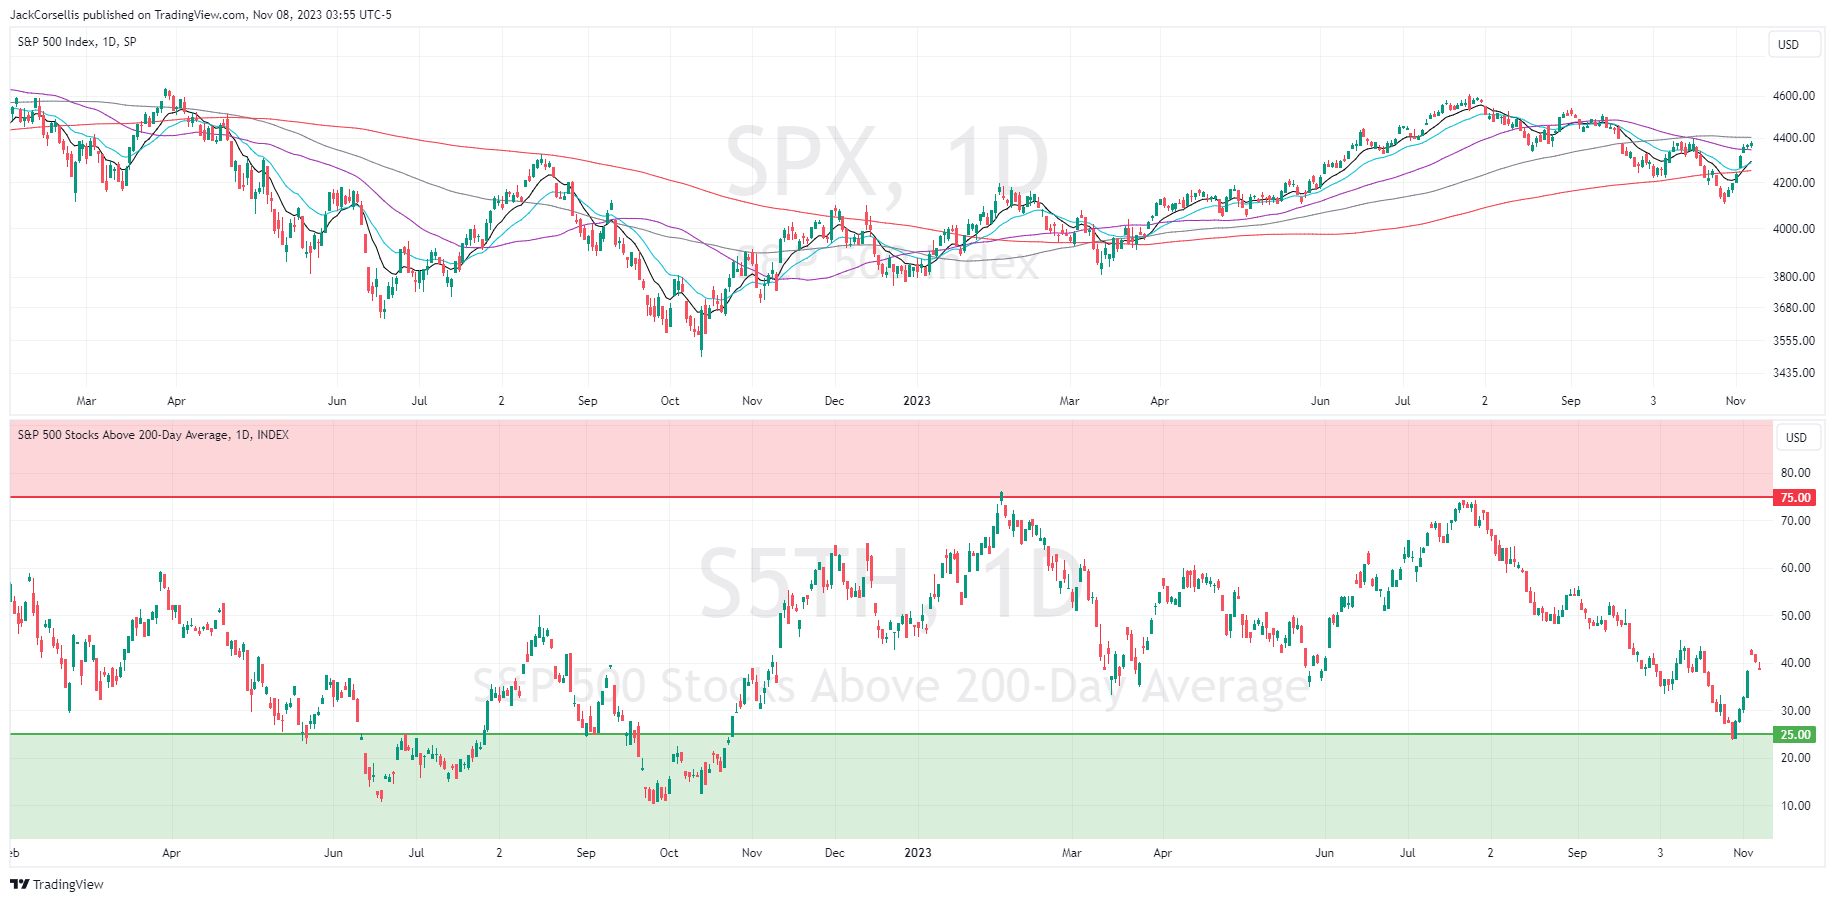
The short-term moving averages are closer to the price action, therefore, more overbought and oversold readings will occur. I give more weight to the longer-term readings, such as the 200-day moving average reading going overbought/oversold, but aware of all readings.
I conduct this same analysis for the % of stocks above key MAs for…