Background
Having only come over to Stockopedia in the last few months, one of the main market concepts I find missing is some kind of indication of how the general market is doing. I love the momentum indicator but it measures momentum relatively not absolutely- there was just as many stocks scoring 99 when the market was falling heavily in 2022 as when it was rising in 2021. Moreover, many of the best books I`ve read on stock market investing have a section on market timing, for example the M of William O`Neill`s CANSLIM stands for the general market, and authors like Minervini and Weinstein agree there are times when you should be in the market and definitely times when you should be at the very least reducing your exposure to the market. However the only reference to market timing which I`ve found is Ed Croft`s use of the 120 day moving average for the AIM Market, which though this has in the past proved a good general indicator of whether to buy small caps or not, any one indicator can whipsaw, provide false signals, or signal too early or late.
The simplest market timing measure
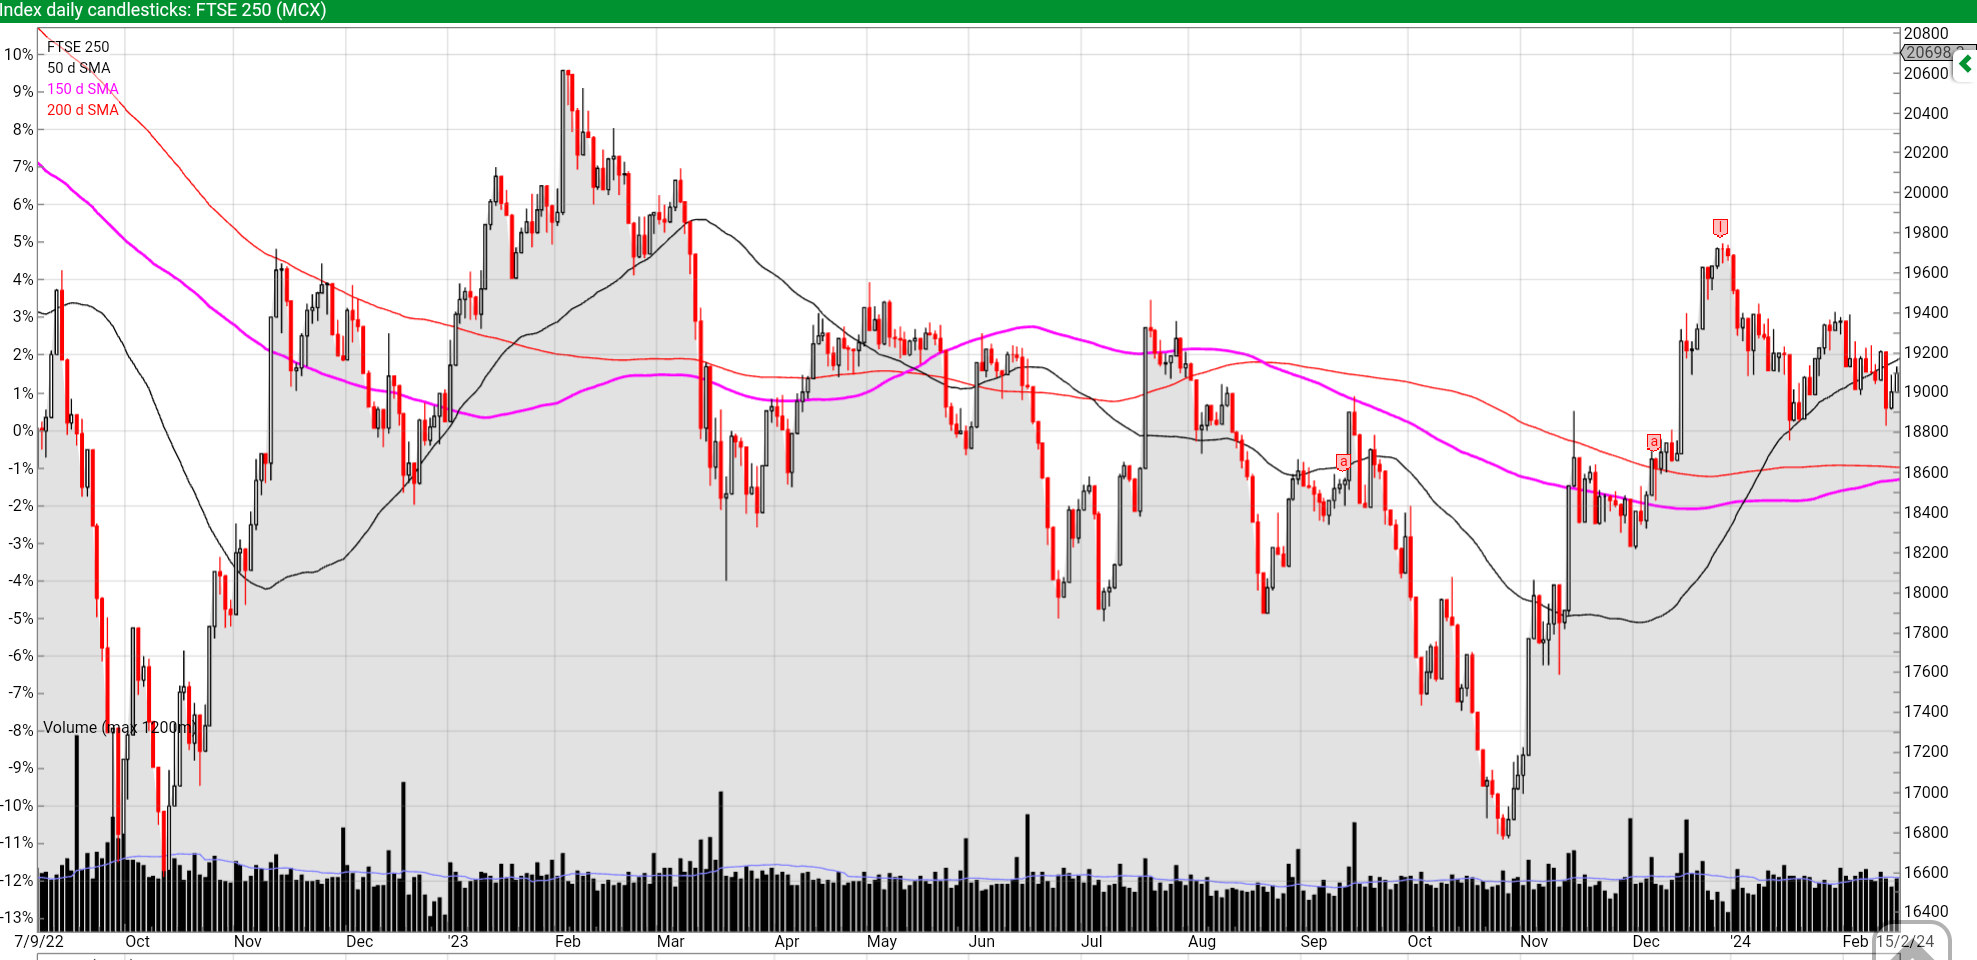
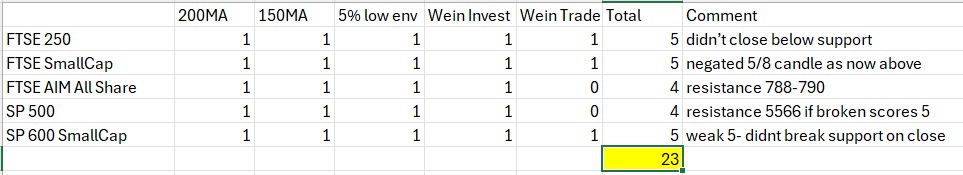
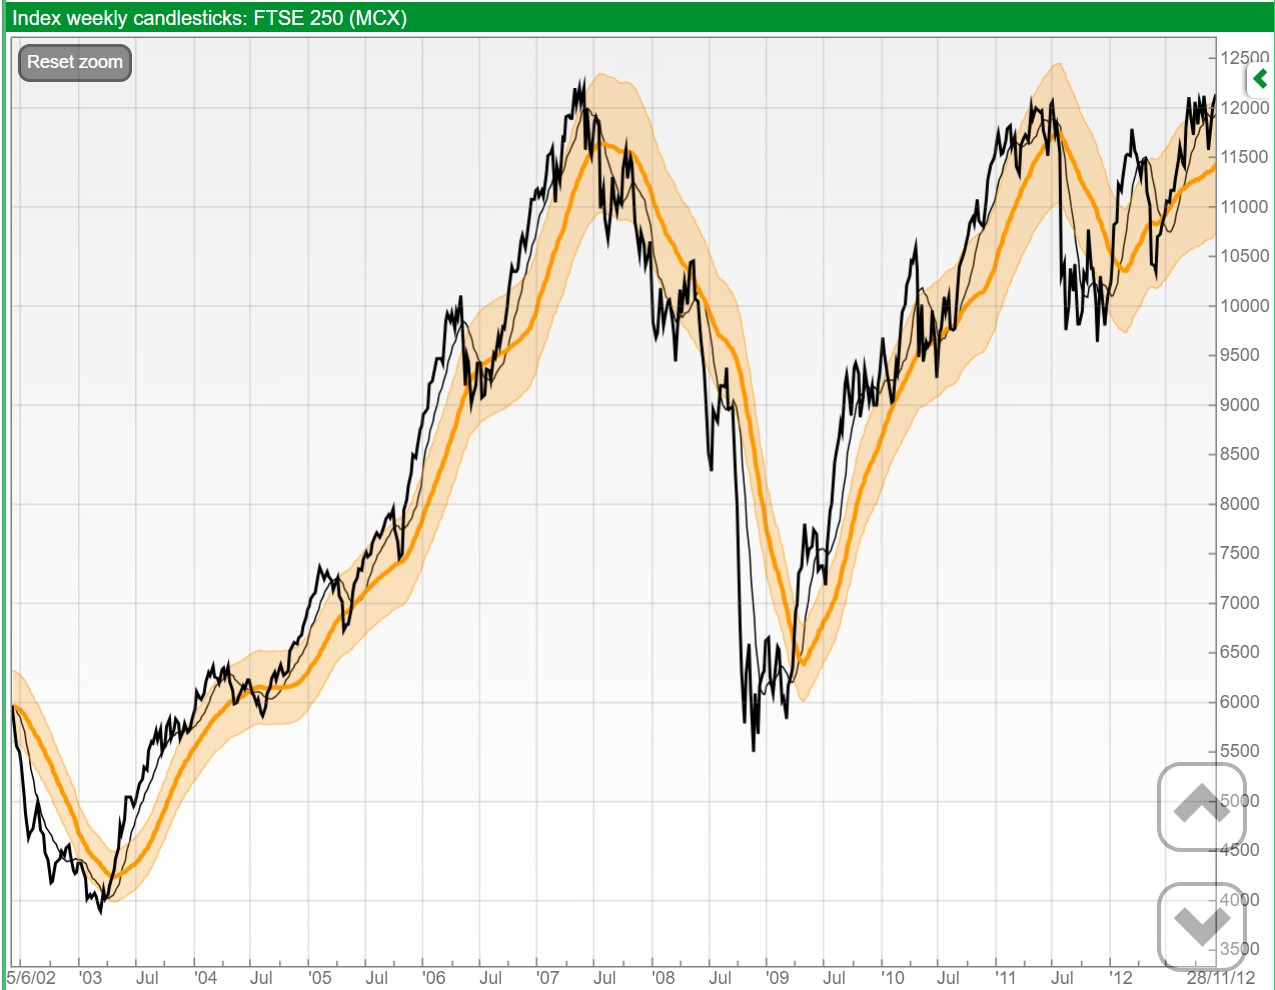
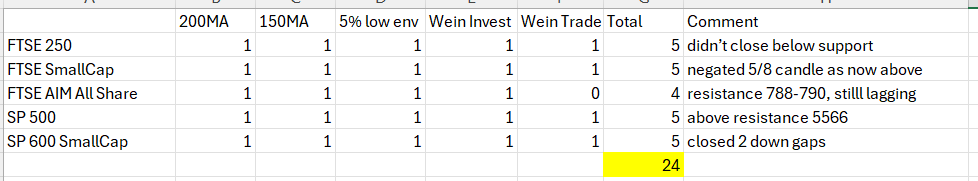
To me the simplest market timing measure, as espoused by Andreas Clenow in his book Stocks on the Move, is simply to only buy shares when the price of the respective indicator (I prefer FTSE 250 as its more equal weighted than FTSE All Share) is above the 200 day Simple Moving Average. Historical studies have shown that not only can this increase your overall performance, but if you exit as price falls below the 200 day moving average, you would have escaped the brutal losses after the Great Financial Crisis or the Covid collapse, ie this approach significantly reduces your drawdown. The downsides are years like 2014 when the FTSE 250 kept zig zagging above and below the 200 day moving average, increasing your trading costs if you kept buying or selling shares based on this methodology.
Stan Weinstein`s approach
•Stan Weinstein in his book Secrets for Profiting in Bull and Bear Markets, has in my opinion an even better way of determining market strength by combining a moving average in his case the 30 week simple moving average (150 day), with the requirement that for a bullish indication the price must move both above the 30 week moving average and break a…