The Alternative Investment Market (AIM) has long been the favourite hunting ground of UK private investors. Not only does it host many of the most dynamic young companies in the UK, but the tax incentives (especially the relief on inheritance tax) encourage interest. But it's also probably the most heartbreaking part of the market, as so many companies disappoint.
Perhaps because of this, the index that tracks the aggregate performance - the FTSE AIM All Share Index - is actually an excellent barometer of private investor sentiment. What's more, due to the tendency of sentiment to "trend" I've discovered that the index is a very useful market timing indicator. It's just flashed a "buy" signal for the first time since mid-2021.
The dismal performance of AIM
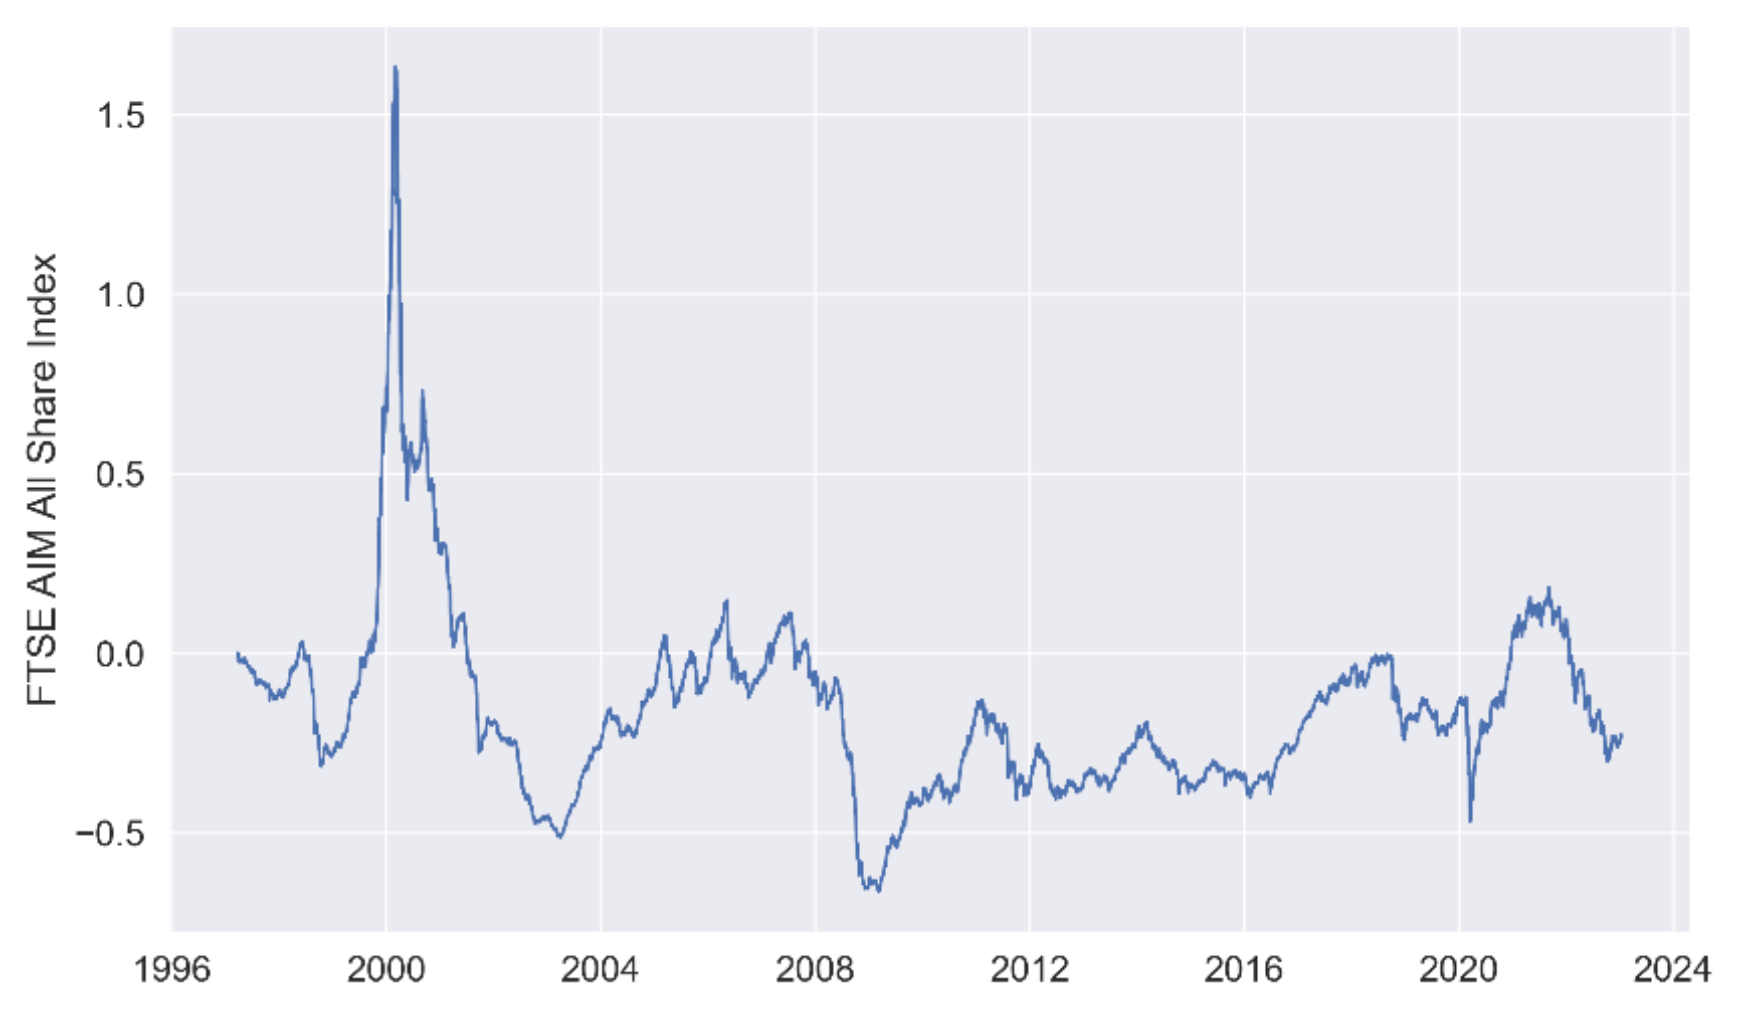
If you look at the performance of the FTSE AIM All Share since 1996 you'd be astonished. It's declined something like 25% over the last 26 years - see the chart below. Heartbreaker indeed. This rollercoaster performance is not for the faint-hearted.
But it trends...
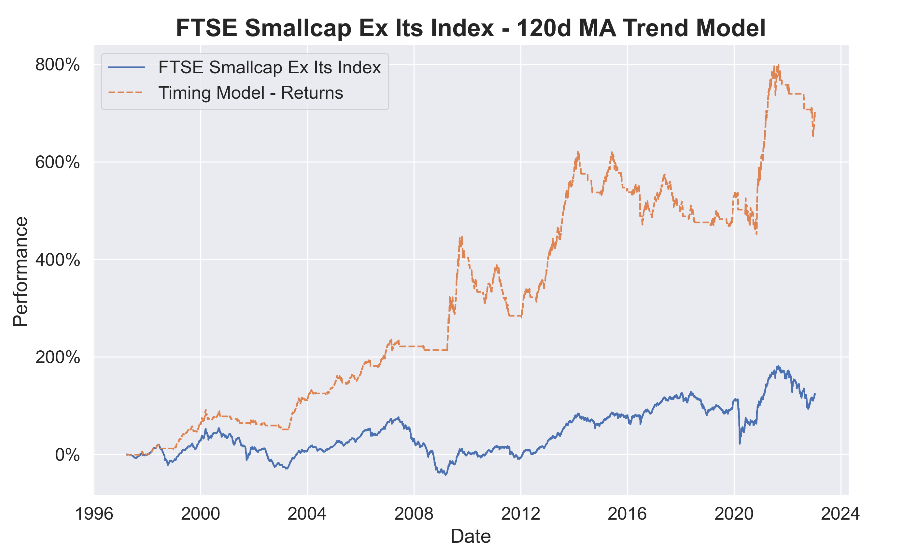
But if you look more closely, you'll see that this index has a strong tendency to trend. One of the simplest trend following models is to buy when a price chart rises above a moving average, and sell when it goes below. Trend following in this way is prone to failure and false signals, and some indexes give far more false signals than others (for example, the FTSE 100 and FTSE All Share are not for trend followers). However the AIM market can create some forceful signals that persist for long periods of time.
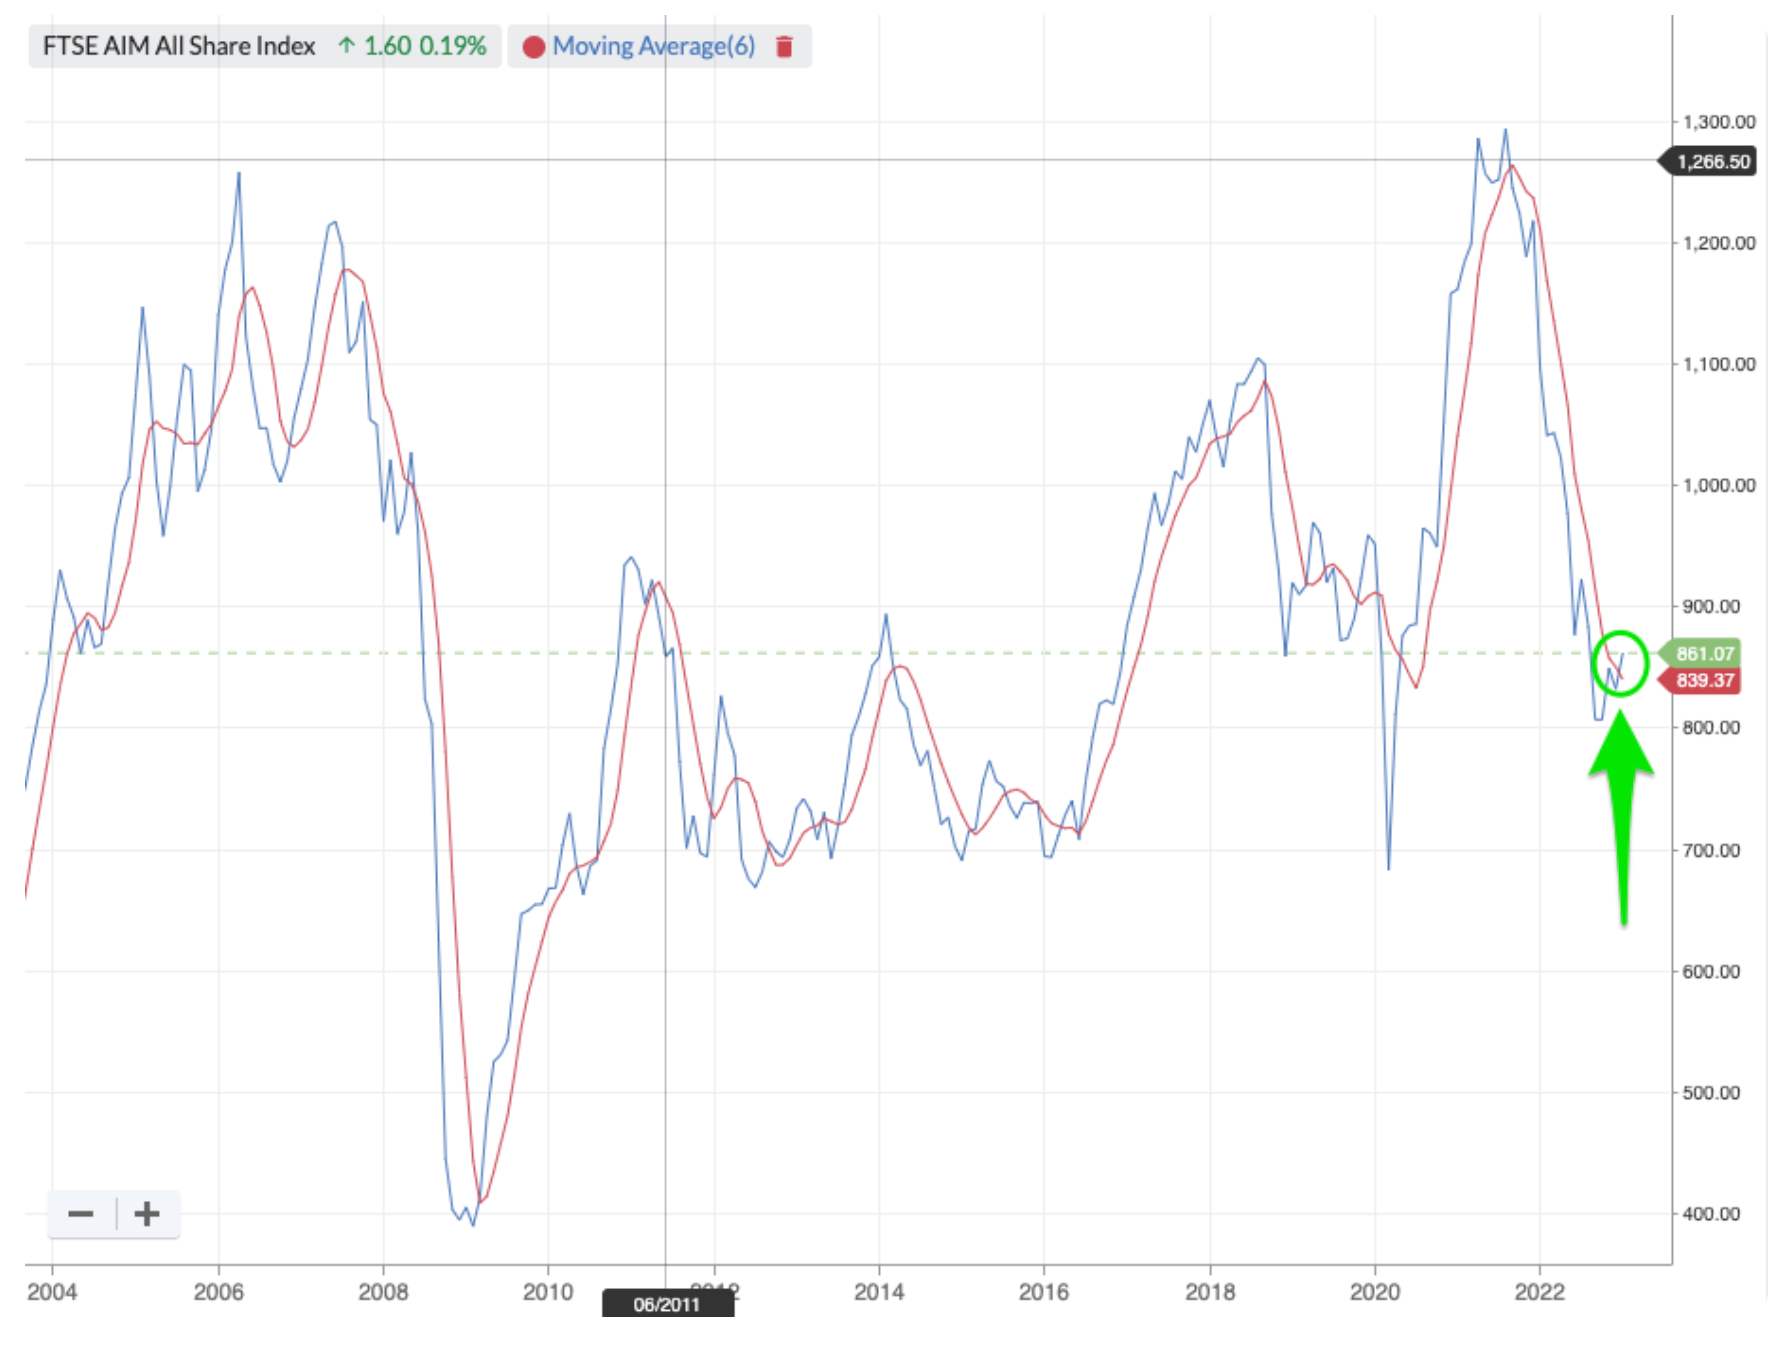
In my investigations, I've found that the optimal moving average to use for trend following AIM is the 120 day (or 6 month) moving average. If you look at this chart, the red line is the moving average and the blue line is the index price. When the blue price line crosses above the red moving average, there is a "buy" signal, and when it falls below, there is a sell signal. As of yesterday, it crossed above the moving average, signalling a buy signal.
Let me whet the appetite for this signal before disappointing you.
If you create a transaction-cost free approach to modelling the profitability of this signal, you find something quite astonishing. It has generated…