Janus Henderson (ASX:JHG) is the highest ranked Australasian stock in the Financial Sector with an overall StockRank of 98. It is also the largest funds management stock on the ASX by market capitalization. Investors in ASX listed fund managers have had a fairly bruising time over the last few years, but it has not all been bad news.
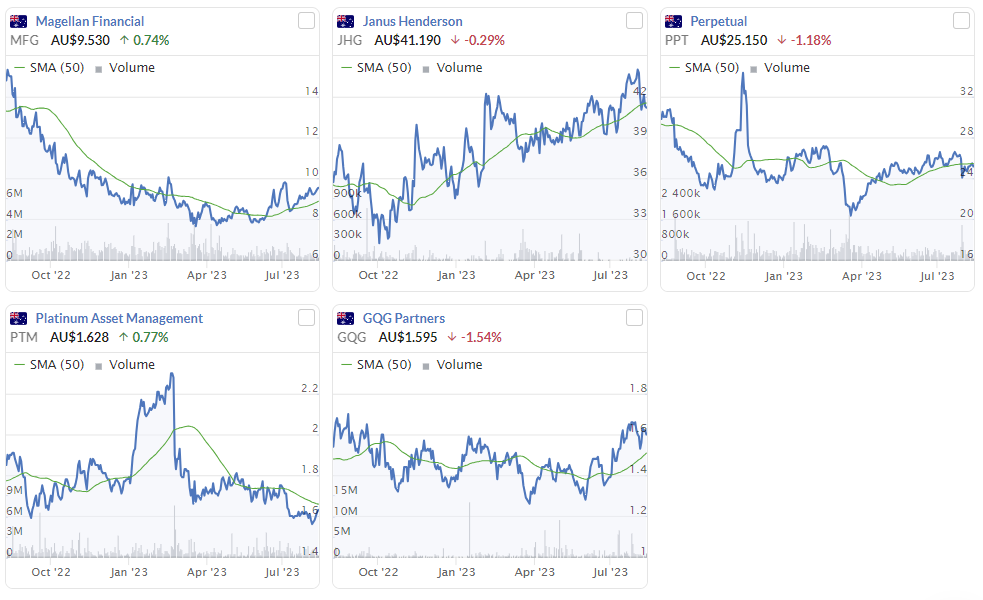
The chart below depicts the performance of the five major fund managers listed on the ASX compared with the S&P/ASX All Ordinaries Index. As can be seen the fund managers have significantly underperformed the index in the last 12 months, however the majority of that underperformance occurred in 2022. Indeed, the fund managers group have outperformed the index since the start of 2023.
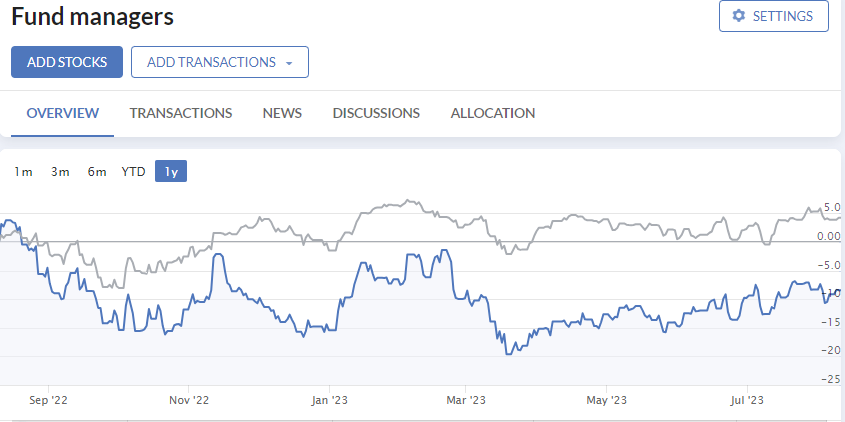
Within those five, Janus Henderson has been the standout performer over the last year.
Janus Henderson has a long history of nearly 90 years and has undergone a lot of corporate shape shifting over that period. Henderson was a UK company and Janus Capital was a US company. The Australian connection occurred in 1998 when AMP acquired Henderson. This marriage only lasted five years and Henderson was demerged from AMP and began trading in its own right on the London and Australian Stock Exchanges in 2003. They made further acquisitions of funds management groups including Australia based Perennial Fixed Interest and Kapstream Capital.
In 2017 the merger between Henderson and Janus took place. The shares are now traded on the ASX as well as the New York Stock Exchange. They are headquartered in London with offices in 24 cities throughout the world, including Sydney, Melbourne and Brisbane.
Today Janus Henderson has about $500 billion AUD in funds under management. They are an active manager employing strategies across multiple asset classes. 62% of the funds are invested in equities strategies, 20% in fixed income and the rest is in multi-asset and alternatives as at the end of June 2023. The chart below shows the breakdown of assets across client types, strategies and locations. (The asset classes differ slightly from above as the chart is as at end of 2022)
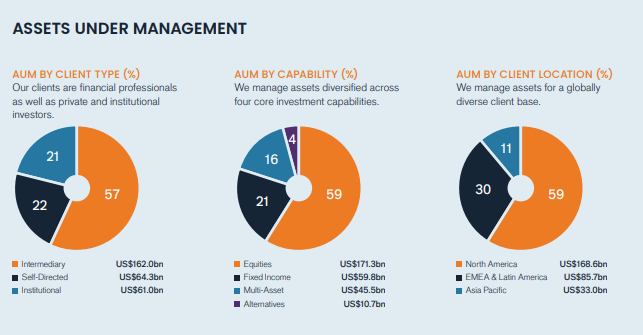
Source: Janus Henderson, Annual Report 2022, 24/3/23
Revenue for a funds management business is directly related to funds under…