It’s been a tough first half of the year for most investors in UK stocks. For all the talk on podcasts about how the UK stock market has been among the best performing in the world in the last 18 months, the group outperforming has been the large cap value stocks. In reality, all UK indices are down since the start of the year, with the more speculative, AIM-listed small caps feeling the most pain 9.4% down.
The NAPS Portfolio - the systematic, 20-stock model portfolio based on the StockRanks, now in its 9th year - is down 4.0% year to date on a price only only basis. Given the portfolio has a skew away from large caps, this is somewhat to be expected in a falling market. The performance is a fraction below the overall 90+ StockRank cohort upon which the selections are mostly based (-3.3%), but below the FTSE All Share which I have long used as a benchmark (+0.5%).
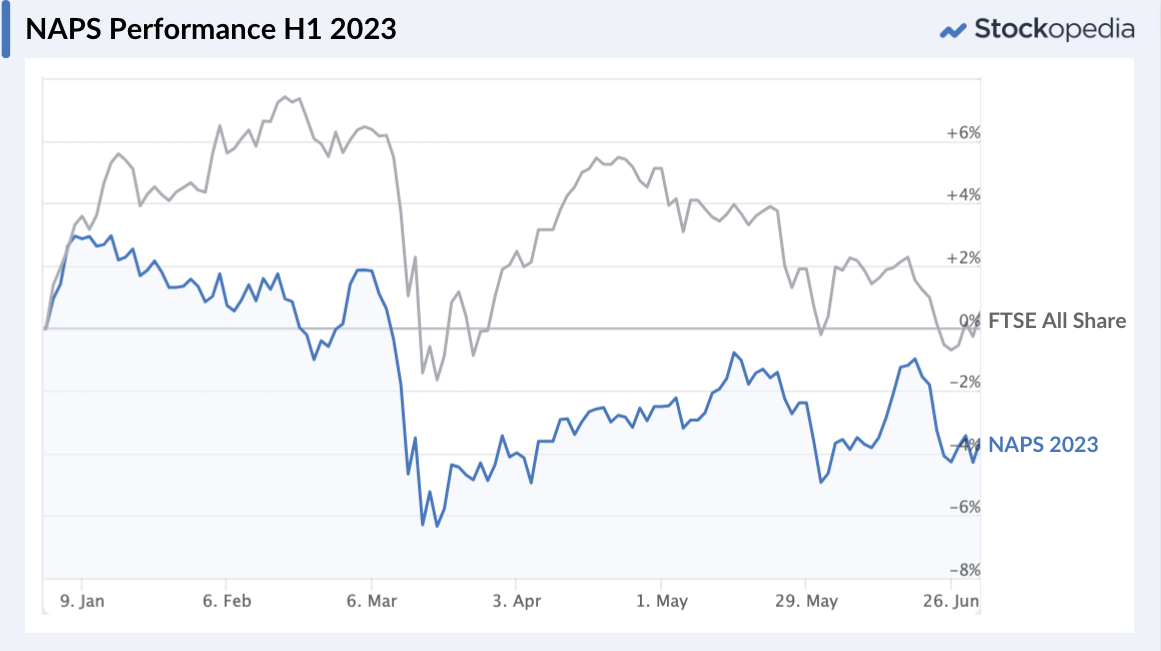
Returns since inception are 166% over 8.5 years, at more than 12% annualised, though the last 2 years have been lean, with an almost 20% decline endured since the summer of 2021.
Performance year to date
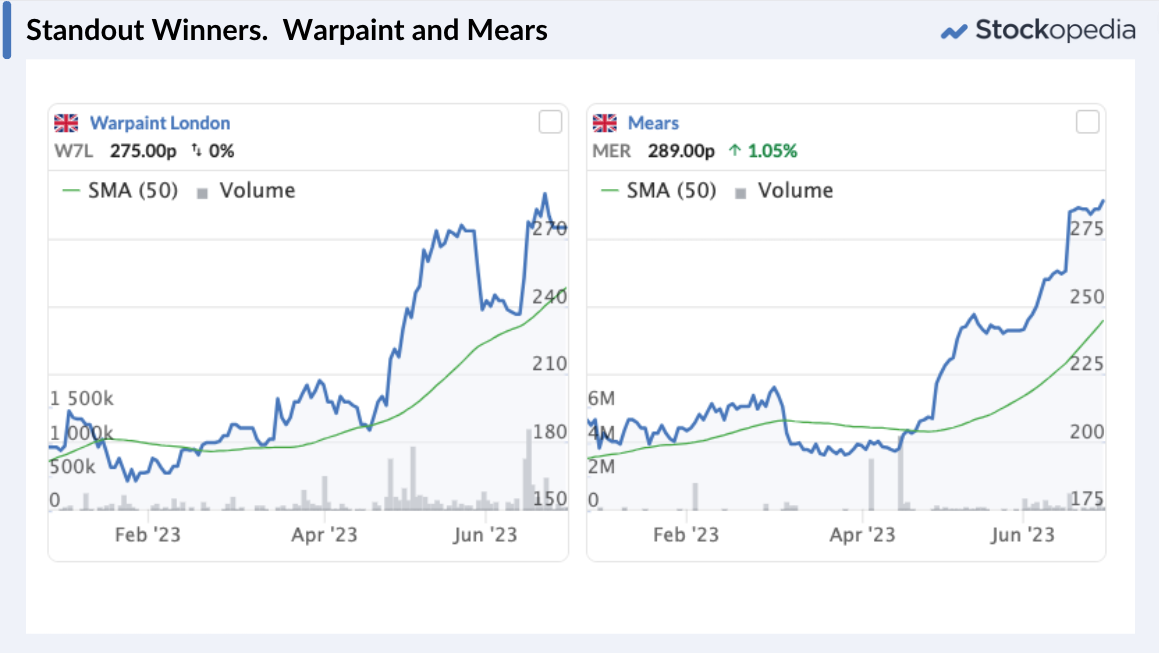
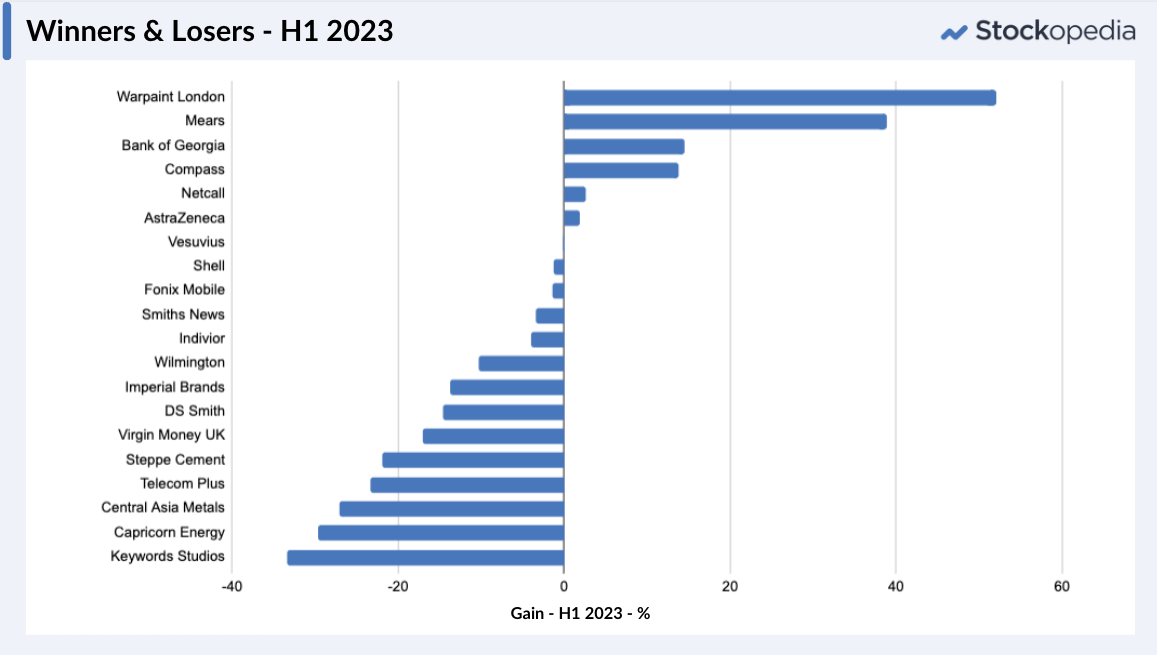
As you might expect, there haven’t been too many winners since the New Year.Warpaint London (LON:W7L) and Mears (LON:MER) have been the standout performers up 52% and 40% respectively.
But weakness in names like Keywords Studios (LON:KWS) (-34%) as well as in the Energy and Mining sectors have dragged the performance down. There are only 7 winners in the portfolio year to date, with 13 losers. In this market, even some more resilient stalwarts like Imperial Brands (LON:IMB) have been punished -16%.
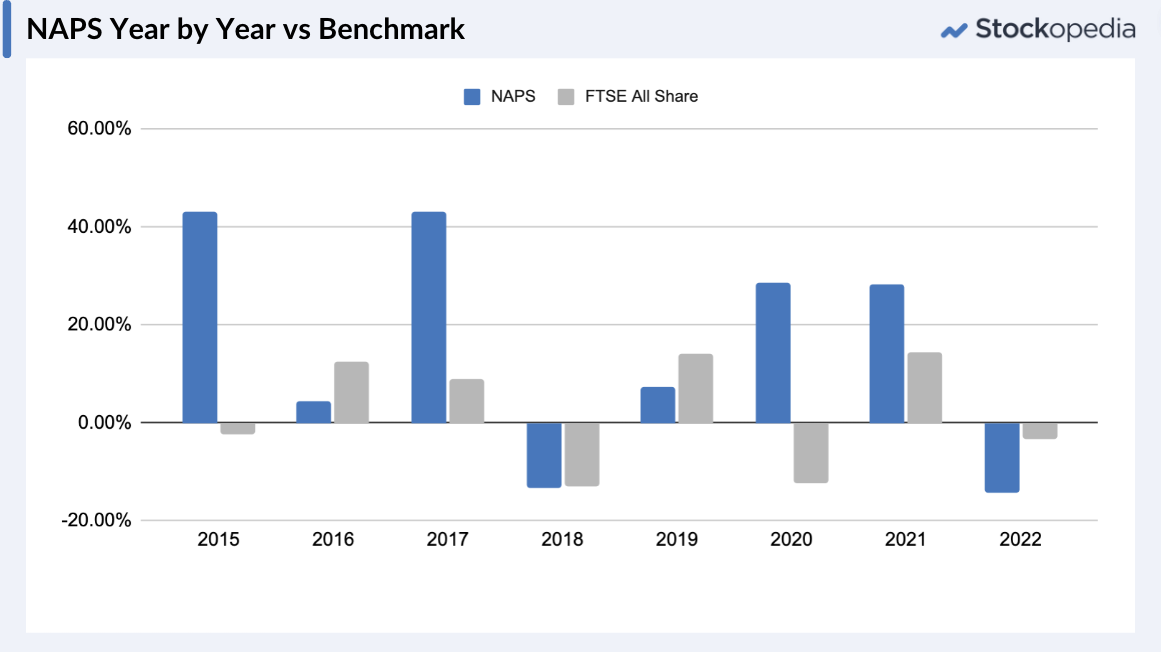
Is this underperformance unusual for the NAPS? No. Since inception the NAPS has underperformed the FTSE All Share half the time. In the eight completed years, it has underperformed 4 times and outperformed 4 times. This is the second time it’s seen a consecutive year of underperformance. It’s the level of outperformance that’s been achieved in the strong years that has driven the long term returns. The three best outperforming years, 2015, 2017 and 2020 saw an average 40% outperformance versus the FTSE All Share benchmark.


.JPG)