Have you ever noticed that sometimes when you buy stocks, the majority seem to rise, while at other times, most seem to fall? Understanding the concept of 20-day moving average (MA) breadth readings can offer valuable insights, especially for swing and position traders in the U.S. market. This tool helps determine when to lean towards a long or short bias in trading by analysing market trends.
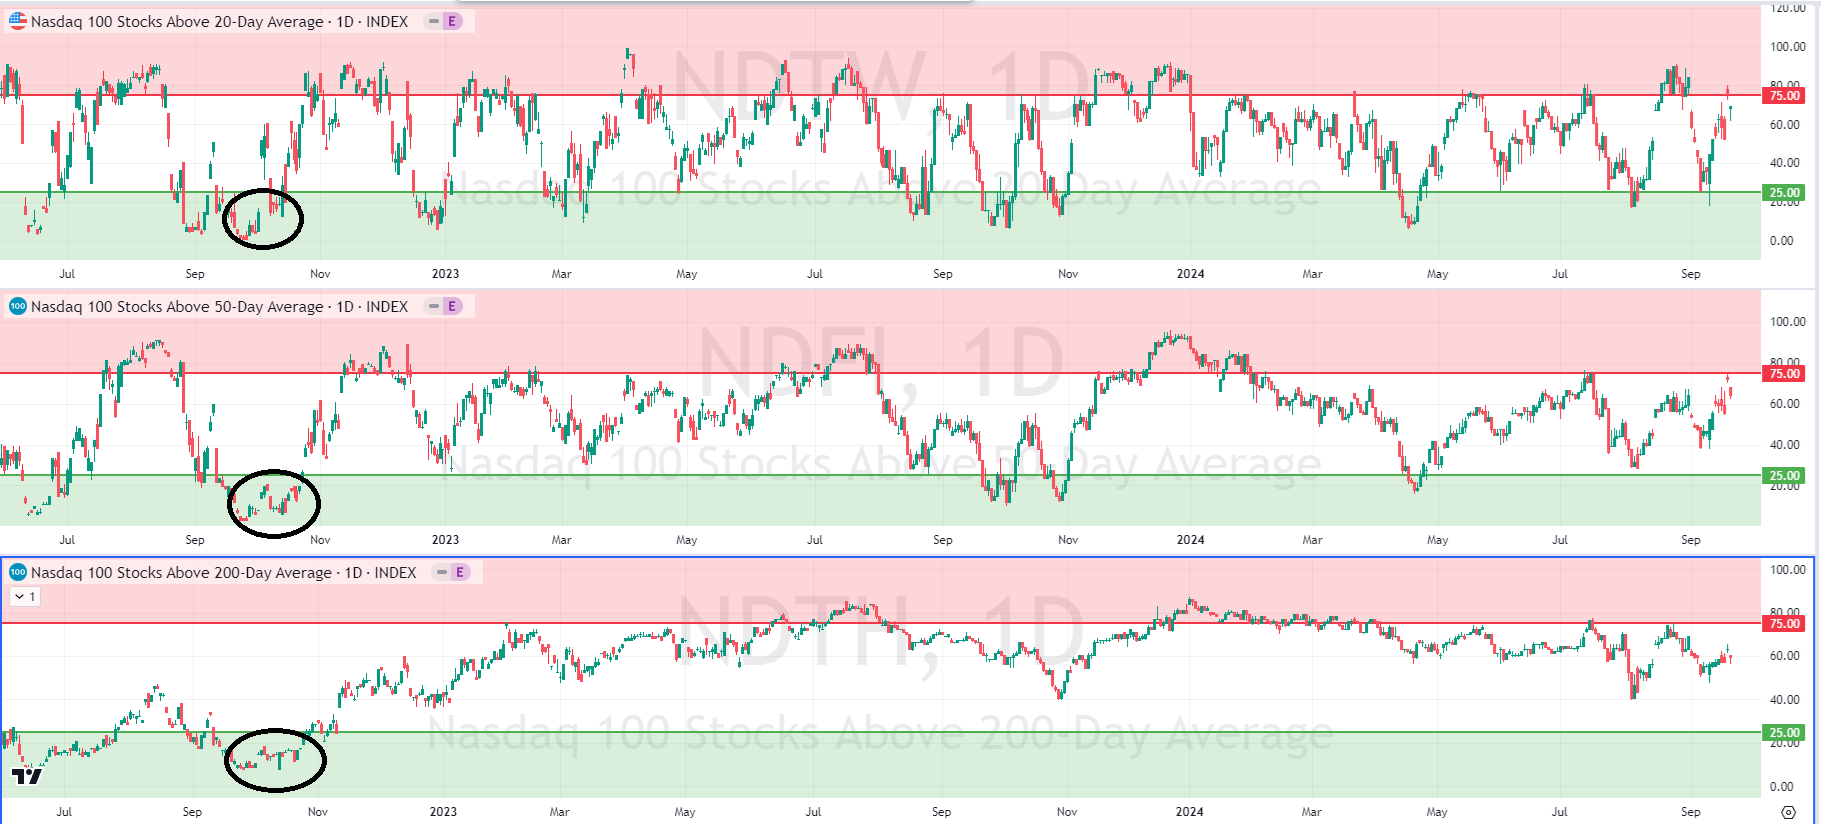
In the analysis below, you'll see the three major U.S. indexes displayed alongside an important indicator: the Percentage of Stocks Above their 20-Day Moving Average (NCTW, NDTW, S5TW). Key dates for both overbought and oversold readings are highlighted to illustrate how these market conditions can shift over time.
These indicators measure the percentage of stocks in each index that are trading above their 20-day MA. Two crucial levels to keep in mind are:
- Overbought: When more than 75% of stocks in the index are above their 20-day MA.
- Oversold: When less than 25% of stocks are above their 20-day MA.
An effective way to interpret 20-day MA breadth readings is to think of the market like the ebb and flow of a tide. The market tends to move from oversold to overbought conditions, and then revert back—much like the tide going out and coming back in.
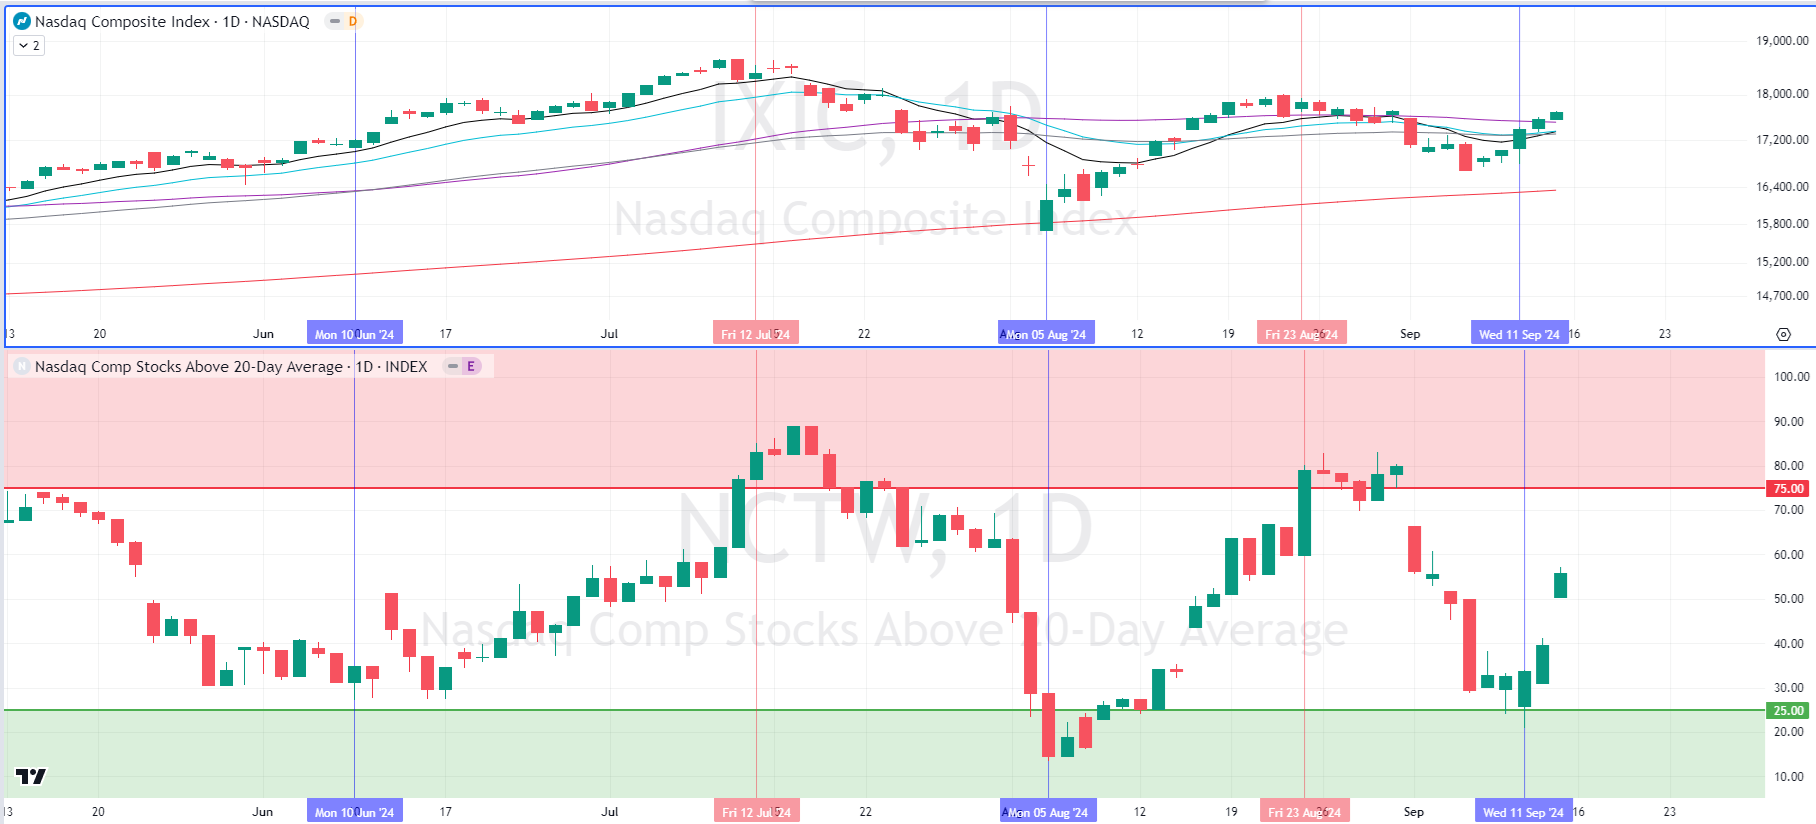
Why is this important for swing and position traders? The timing of trades becomes crucial. For instance, when would you think it’s more advantageous to initiate long positions—when the market is oversold or overbought? Consider specific dates, like July 12th vs. August 5th. The accompanying chart of the IXIC vs. NCTW provides a clear example.
For traders focused solely on long positions, these indicators can be invaluable. They offer a sense of when the market tide may be shifting in your favour or against you, helping manage expectations and, just as importantly, emotions. This understanding can improve decision-making and enhance your overall trading strategy.
IXIC vs NCTW
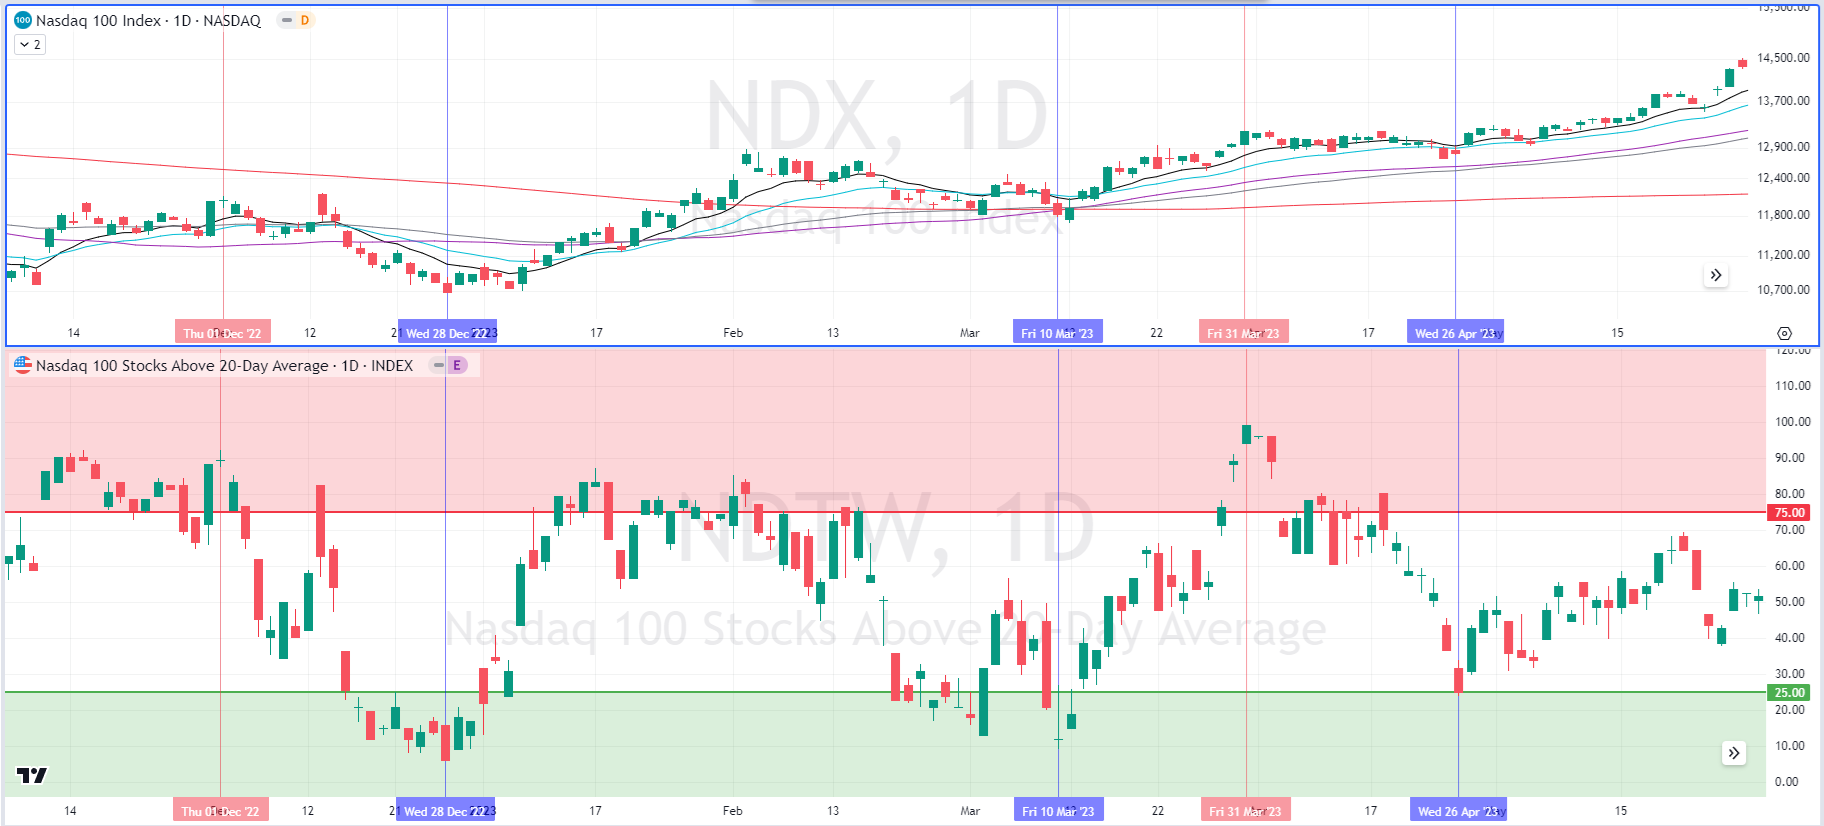
NDX vs NDTW
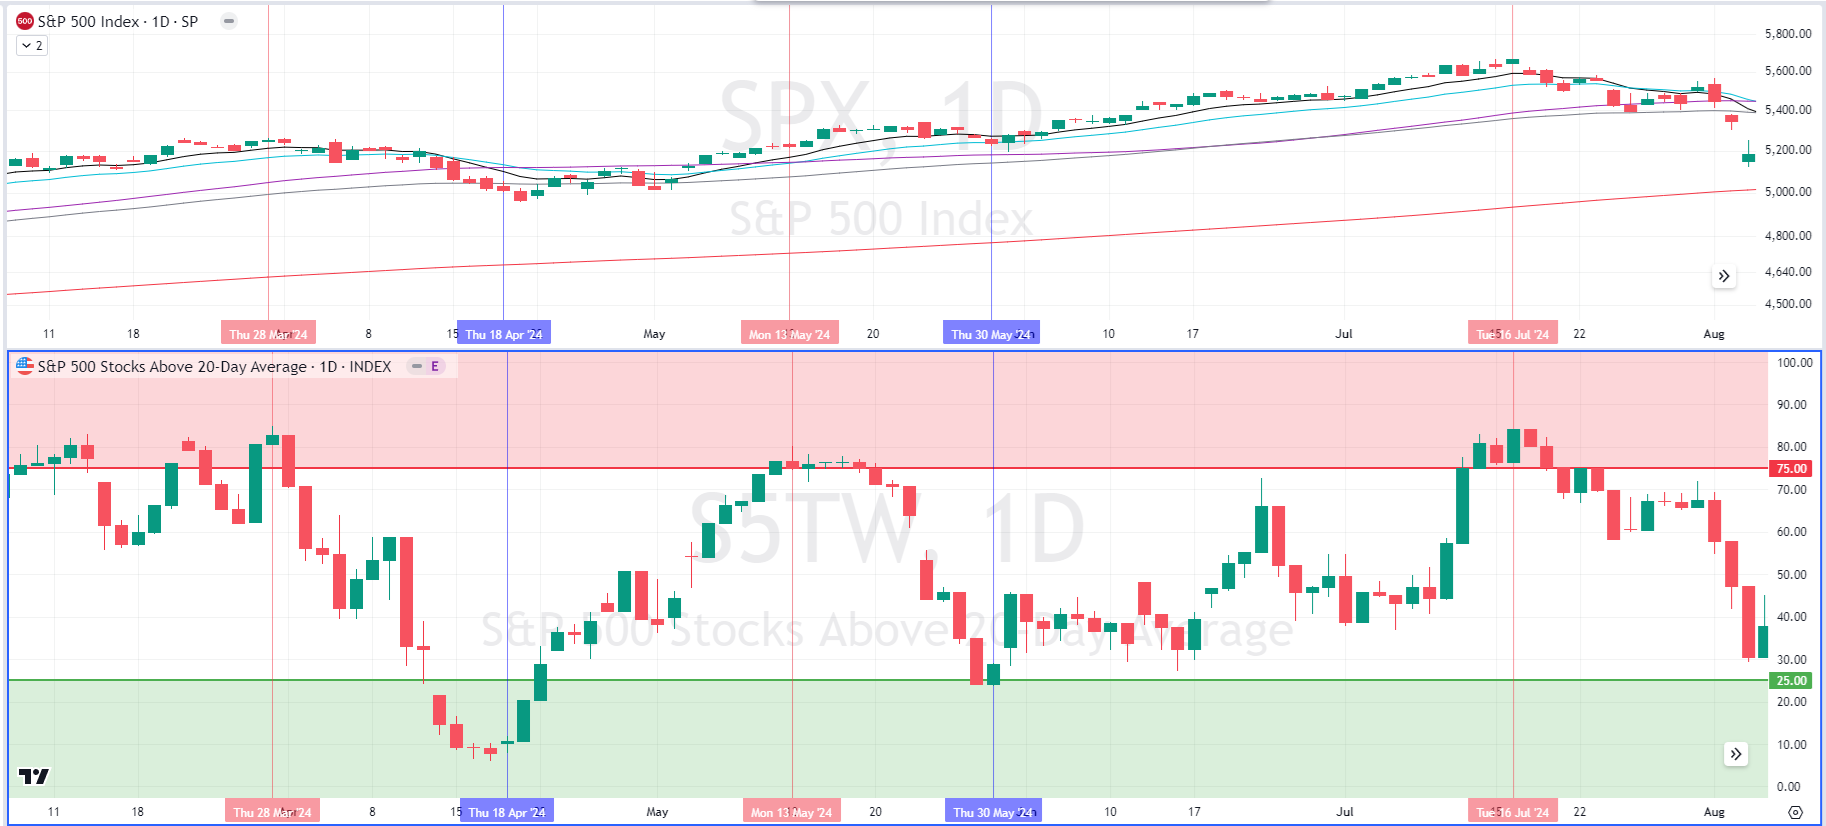
SPX vs S5TW
Here is a recent YouTube video I filmed if you'd like a video explanation:
Take care and good trading,
Jack