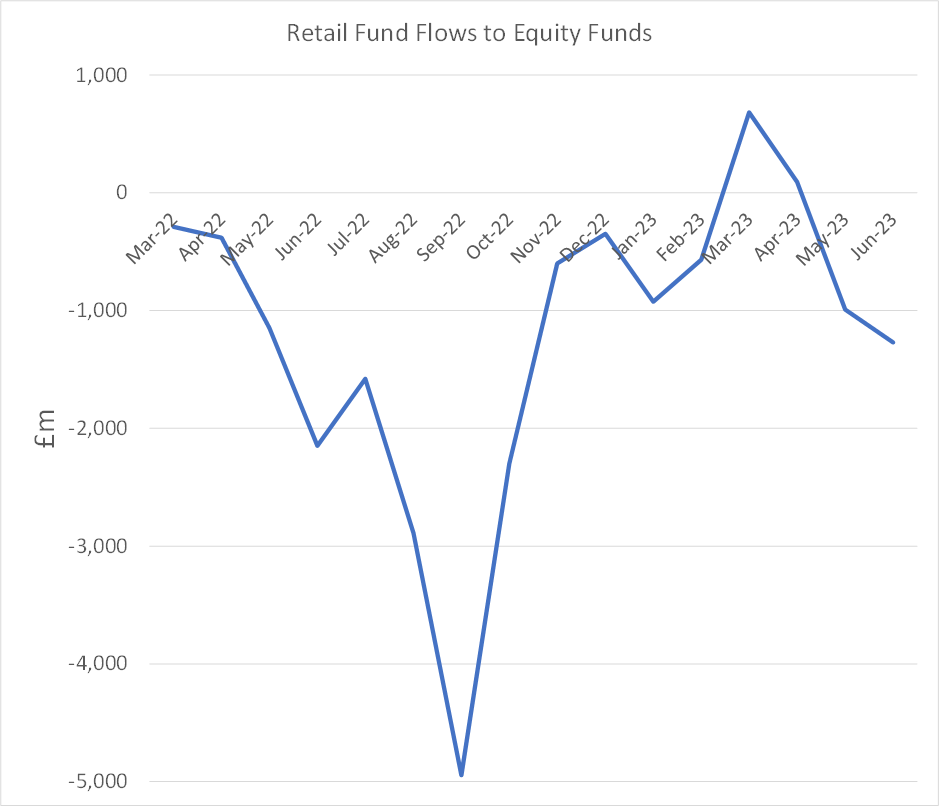
In May this year, I created a screen to look for UK stocks that looked simply too cheap. I picked the midcap space because I believed midcaps would be the first to benefit from any fund flows back into the equity markets. Sadly, those flows have yet to materialise. Indeed, after brief positive flows into equity funds in March and April this year, fund flows have since gone negative again:
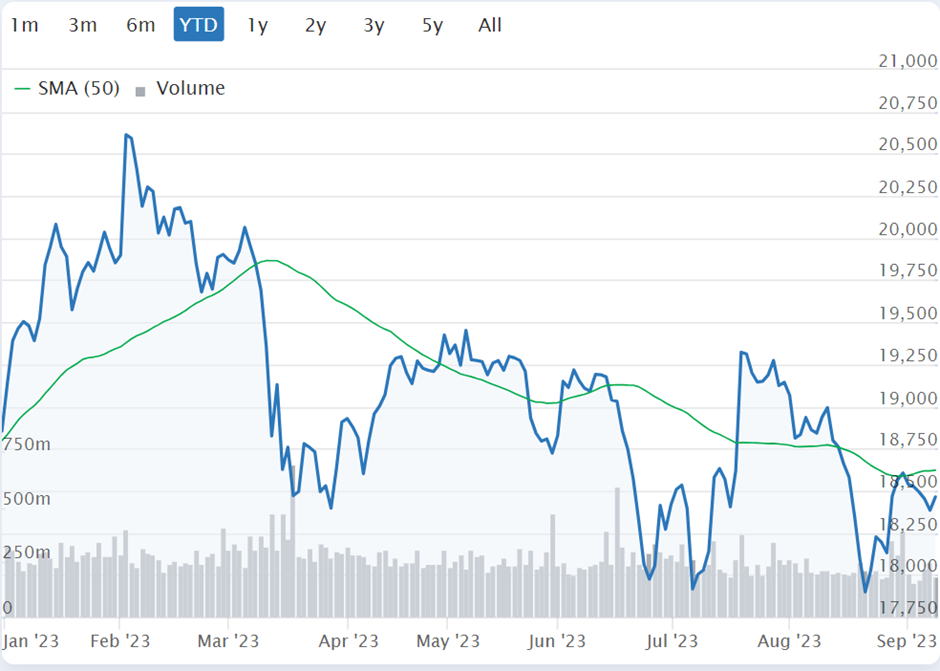
And this is reflected in the rather sickly performance of the FTSE250 since that date:
The narrative remains that the UK is the "sick man of Europe" and is suffering from lacklustre GDP growth and that this makes the UK uninvestable. While the UK has been far from outstanding on the international stage, this narrative misses a couple of key points. The first is that there isn't a positive correlation between short-term economic growth and stock market performance. This may seem counter-intuitive since countries that have won the growth race have also won the stock market race over the very long term. However, when Wharton Professor Jeremy Siegel looked at the data for his book Stocks for The Long Run, he found that when comparing between countries, or time periods within the same country, stock market performance is negatively correlated with GDP growth. [The main explanation for this is a value effect; the fastest-growing countries tend to have stock markets on overly high multiples. However, it may also be a function of the returns going to fresh capital rather than the holders of existing stocks.]
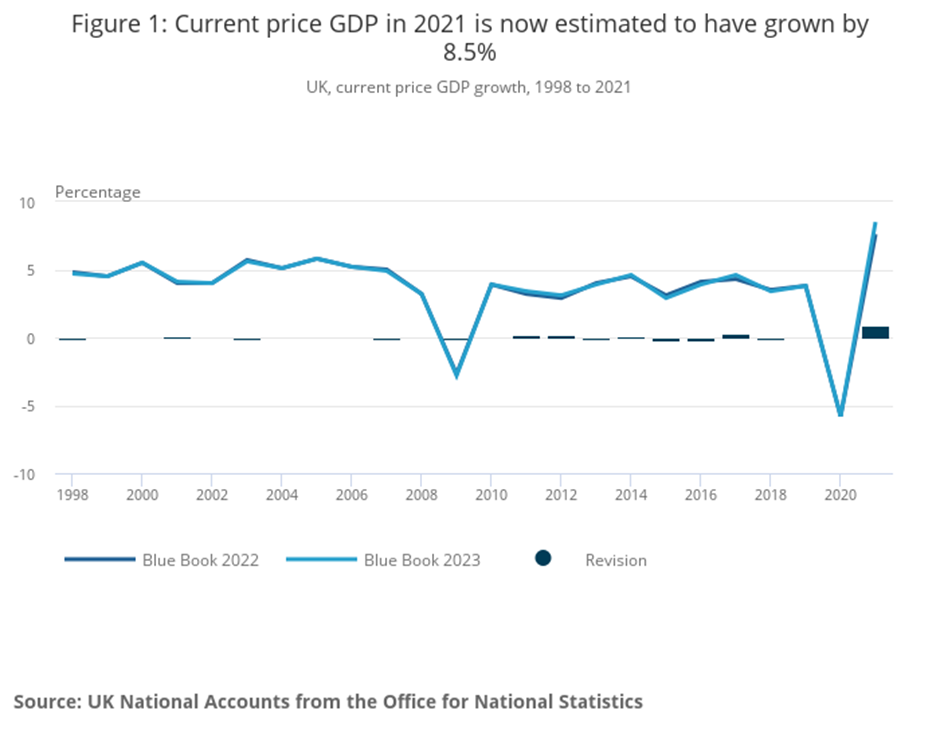
The second point is that GDP estimates are just that, estimates. They are based on survey data and statistical methodologies, and these face significant revisions over time. And one such recent revision paints the UK in a much better light:
The Midcap Madness screen aimed to find stocks that simply looked too cheap. These were the screening criteria:
Price-Earnings Ratio Forecast 1y < 10
I want companies that are forecast to remain cheap rather than one-off inflation beneficiaries.
Dividend Yield Rolling 1yr > 5%
While this isn't designed to be an income screen, a large dividend yield is a sign of companies where the price has declined, but the…