Welcome to Momentum Monday, the end of July and the beginning of reporting season.
Access your reporting season calendar here. It has seen a number of new inclusions since it was originally published, so be sure to check on it periodically.
We are approaching what is likely to be “from a fundamental perspective” a weaker reporting season than usual. As I mentioned in the “Forewarned is Forearmed” article last Wednesday, with downgrades outstripping upgrades this confession season, margin compression is what the market will be watching most closely.
So with this backdrop, most analysts are not expecting companies to shoot the lights out, but what you need to be careful of however is companies who disappoint relative to their peers as there is a real risk they will be dumped and left behind.
Also I want to thank those of you who have already engaged with our “Empower Others” program. We look forward to helping your friends anf family once they are ready to reach out to us. If you want to learn more about the program you can read about it here
The content for this week's edition:
Broader market sentiment
Member corner
Stocks in the “Shine Zone” (including changes)
52 week high screen (including changes)
A reminder that you don’t have to read all this contribution. Simply scroll to the area of interest.
Broader Market Sentiment
We look at the direction of both the US and ASX markets to gain an understanding of the broader sentiment at the minute. It is important to stress here that I DO NOT use this to time my entry or exit out of stocks. I prefer to use the individual charts of stocks to do that. However I find it useful in helping us determine how aggressive/cautious traders should be in their trading. In short the more positive the broader market is the more risks you can take and vice versa.
US / S&P500
The US continued on its positive trajectory last week. The S&P rising 1.01% and closing slight above the March 27 lower high re-confirms our view that the new target is now the all-time high of 4766
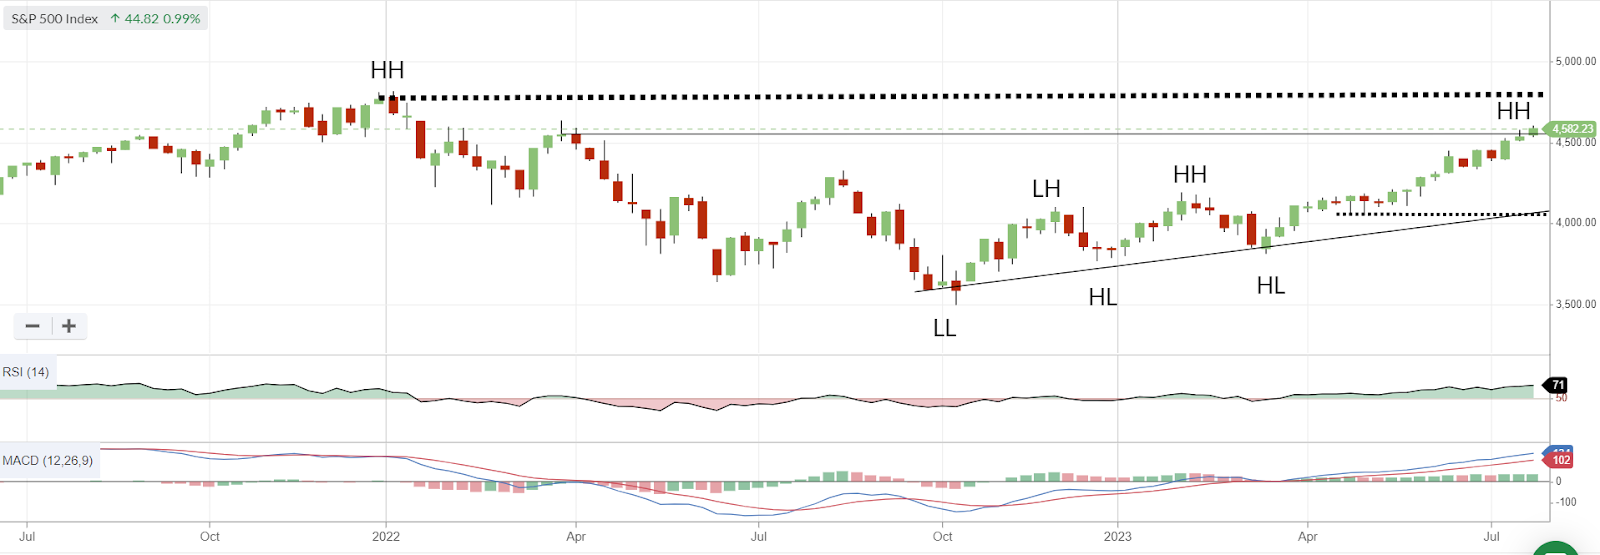
S&P500 Weekly chart
Much…