Market Musings 040223: Coppock Curve confirms bull trend
The long-term Coppock indicator flashes green for a potential long-term bull market
Summary
Coppock indicator turns positive for UK, France, US stock markets
US ISM Services PMI January report was surprisingly strong
Leading regions are: UK, France, Sweden, Mexico
Leading investment styles are Europe Value, US Mid-cap Value
Leading cyclical sectors are: Europe Banks, Industrials,Building + Construction
Leading growth sectors are: Europe Technology, US Semiconductors
The presence of Construction/Homebuilders is particularly surprising, given the global housing recession in progress…
Podcast: Real Estate blues or opportunity?
Is real estate still the biggest asset class worldwide?
What is the short-term outlook for European Real Estate?
Given today’s economic and financial context, shouldn’t investors avoid the Real Estate sector?
What are the long-term drivers for property demand?
What about the French market?
Coppock Curve indicator gives thumbs up to stocks
What is the Coppock curve? According to Investopedia:
The Coppock Curve is a long-term price momentum indicator used primarily to recognize major downturns and upturns in a stock market index. It is calculated as a 10-month weighted moving average of the sum of the 14-month rate of change and the 11-month rate of change for the index. It is also known as the "Coppock Guide."
Why is the Coppock Curve useful as a bullish stock market indicator?
The Coppock Curve is a technical indicator that provides long-term buy and sell signals for major stock indexes and related ETFs based on shifts in momentum.
The indicator is designed for use on a monthly candlestick chart, where each candle is one month.
A reading above zero on the indicator signals a buy, while a drop below zero is a sell signal.
In the case of the US S&P 500 index, this Coppock Curve has turned up from a low negative reading to positive, thus signalling a buy on US large-caps.
Coppock curve gives positive signal for S&P 500

Source: tradingview.com
The same can be seen on the FTSE 100 index:
Coppock curve gave a positive signal for the FTSE 100 too
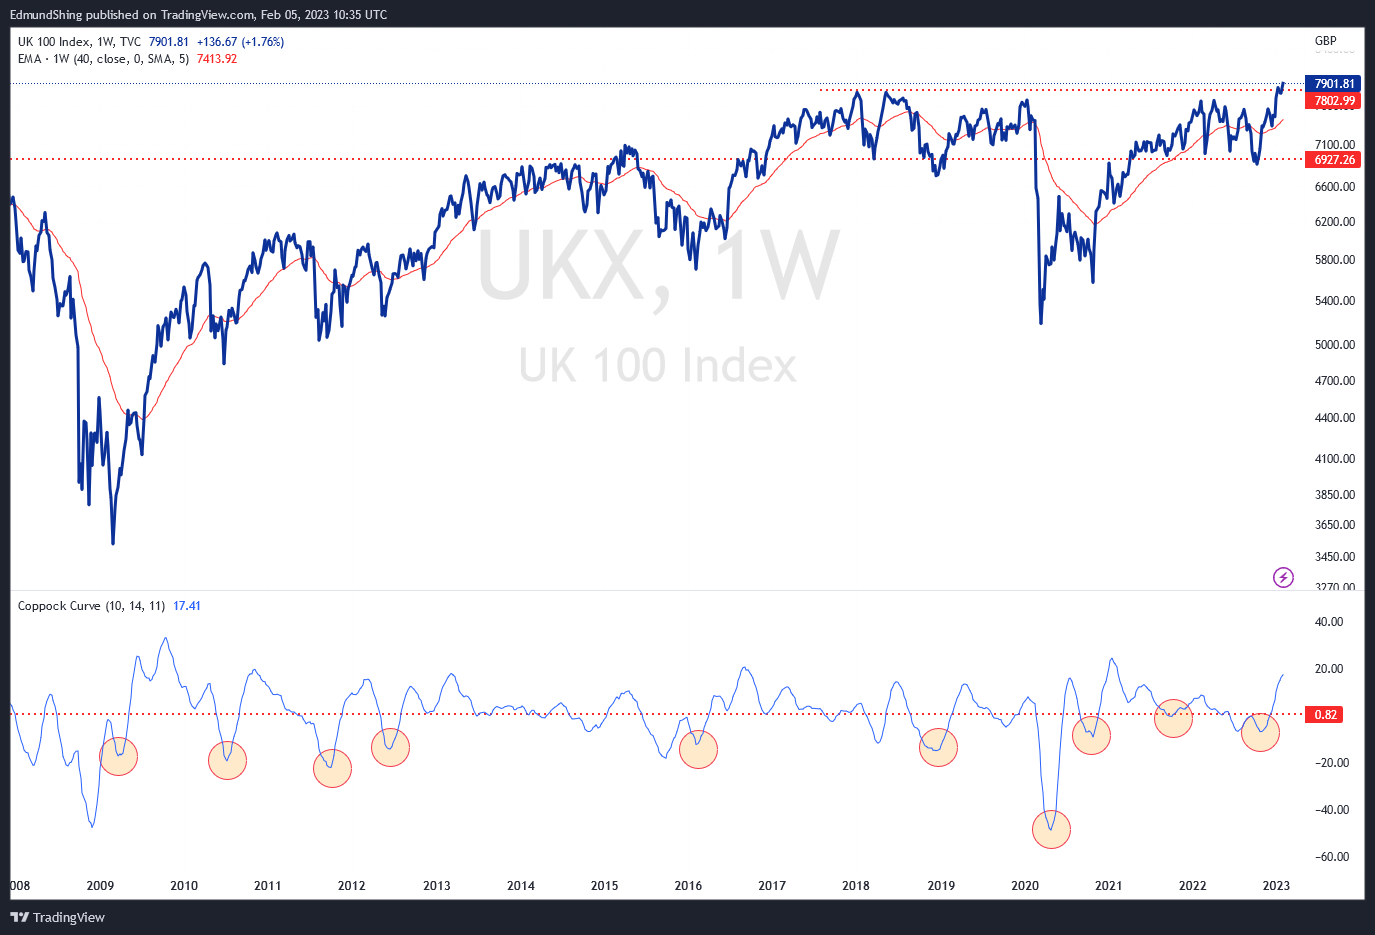
Source: tradingview.com
If anything, the FTSE looks more bullish…