The Winners
Stock market investors in developed countries have long been winners. They have enjoyed higher returns in exchange for higher volatility than any other asset class. These excess returns have allowed them to retire earlier, more comfortably and pass greater wealth onto their children. In their long-term study of asset returns, Dimson, Marsh, and Staunton found that equities significantly outperformed. For example, the following chart from their analysis in the Credit Suisse 2022 Global Annual Returns Yearbook shows annualised real returns for the U.K. markets:
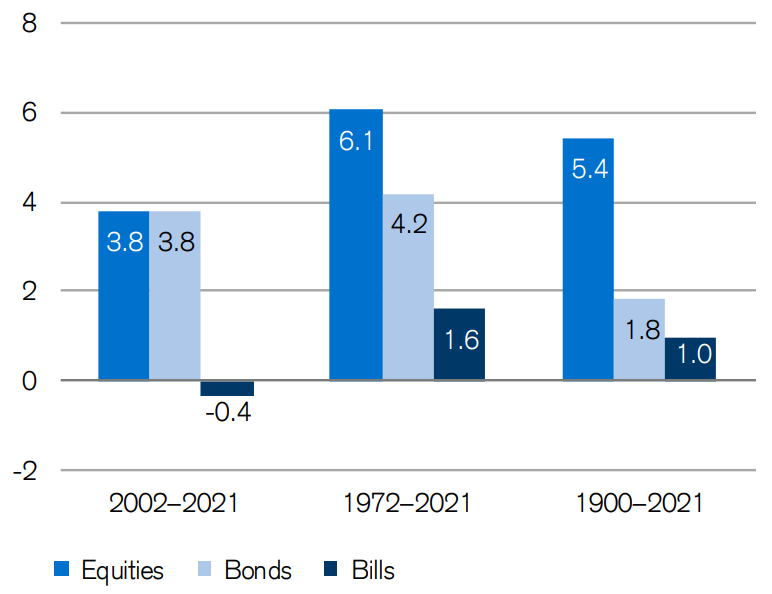
Over an extended period, equities are the clear winner.
The Losers
That stocks outperform T-Bills has long been market orthodoxy. So it was a surprise when a recent paper looking at the returns of almost 64,000 global stocks appeared to challenge that universally accepted truth. The paper by Hendrik Bessembinder, Te-Feng Chen, Goeun Choi and K.C. John Wei looked at the long-run shareholder outcomes during a 30-year period starting in January 1990. Here is the surprising bit:
… the majority, 55.2% of U.S. stocks and 57.4% of non-U.S. stocks, underperform one-month U.S. Treasury bills in terms of compound returns over the full sample. Focusing on aggregate shareholder outcomes, we find that the top-performing 2.4% of firms account for all of the $US 75.7 trillion in net global stock market wealth creation from 1990 to December 2020.
And this isn’t just a U.S. phenomenon where recent S&P500 returns have mainly been driven by large cap tech stocks. Instead, the situation is even more extreme for the rest of the world:
Outside the U.S., 1.41% of firms account for the $US 30.7 trillion in net wealth creation.
However, Bessembinder et al. say their finding doesn’t, in fact, contradict the evidence of Dimson e al. They also found that the mean buy-and-hold return across stocks greatly exceeds the U.S. Treasury bill return at each horizon. They explain that the difference between the positive return premium for the broad stock markets and the negative premium for most individual stock returns is due to something called “skewness” in the distribution. Skewness means that data points are not distributed symmetrically to the left and right sides of the median on a bell curve.
There is a strong positive skewness in the distribution of returns to individual stocks, particularly at longer horizons. This is visible in…