Rolls-Royce’s shares are in the doldrums, but its technical charts are signalling big moves in one direction or the other, where will it go?
Looking at Rolls-Royce’s stock chart, using technical indicators as overlays, there is a pattern emerging for a BIG MOVE.
Rolls saw its shares fall by 60% from their peak but has since recovered from some of its losses. Now, with the disclosure of its record statutory loss of £4.6bn (incl. a £4.4bn currency hedge write-down of £4.4bn and £671m in bribery charges, the latter to be paid in five-year instalments with the first-year being £293m), how does it the affect its share price movement?
P.S. I have not done a fundamental analysis.
Can the
“technical chart patterns” draw out the path of Rolls-Royce’s share price?
(Click Here for chart Enlargement)
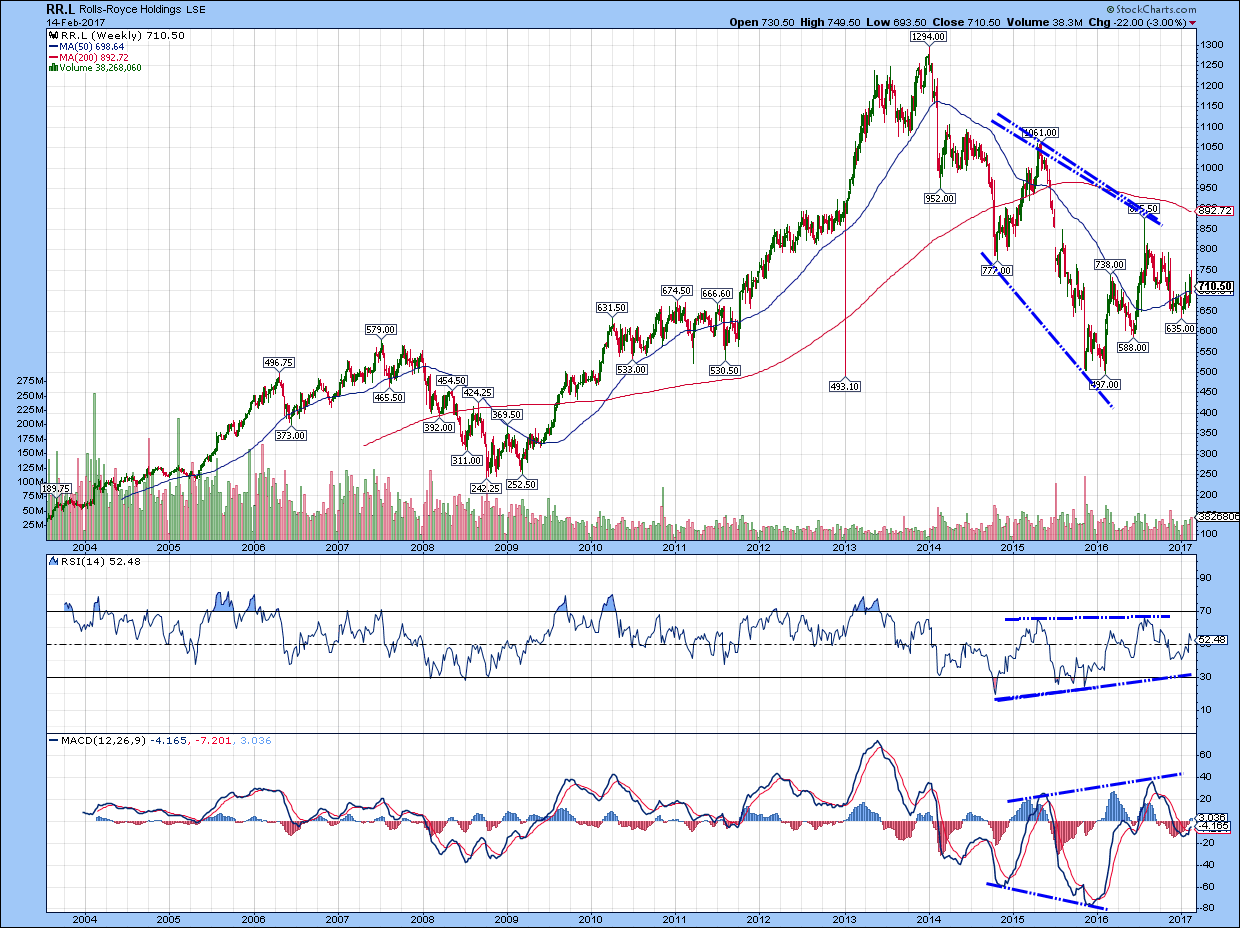
Notice the downwards trajectory of Rolls share price from
£13/share to £5/share and recently recovered to £7.10/share.
Now,
observe the momentum indicators in the MACD and RSI displaying a higher highs patterns, whereas Rolls’s
share price showed a higher low, a
signal that usually lead to a fall in the share price.
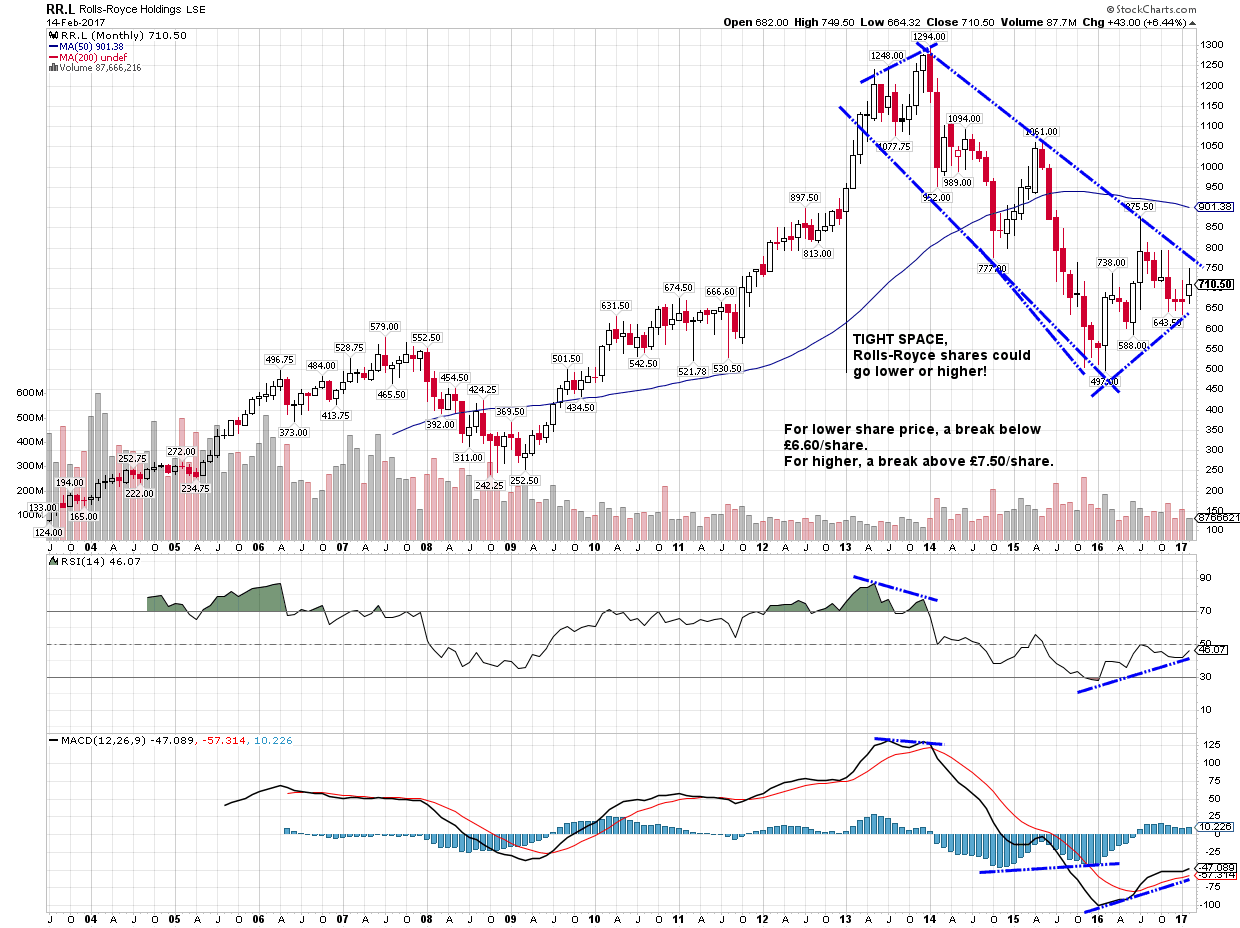
Now, for the monthly chart:
(Click Here for chart Enlargement)
Looking at the “3-D
Rectangle” pattern on Rolls’s share price, it looks like a clear pattern
has emerged. The direction of the share price can go higher or lower. All this
depends on the fundamentals of their business cycle.
Where is Rolls-Royce shares heading?
The observations from the FT financial tearsheet of Rolls-Royces showed its total debt grew from £2bn in 2011 to £9bn by 2016, while earnings have deteriorated.
Gone are the heydeys of generating £1bn+ operating cash flow
with negative cash outflow of £400m.
Looking at its forecast:
Analysts are split between 3 buys and 4 sells, although 9 analysts say Rolls-Royce will underperform. And the share price forecast range from £4.75/share to £9.35/share. The current share price is £7/share.
Earnings forecast for 2017 and 2018 will be half of 2013 at around £0.35/share.
All in all, if I was to choose “heads” for the share price to rise or “tails” to go down, then there is a 65% chance of it being “tails”, and that’s due to accounting changes, worsening leverage (debt increase) and stagnant EPS growth for…