Data provided in this post is from the books:
(1) Thomas Bulkowski Encyclopedia of Candlestick Charts (used over 4.7m candlestick data points for research) and
(2) Toby Crabel Day Trading with Short Term Price Patterns and Opening Range Breakout
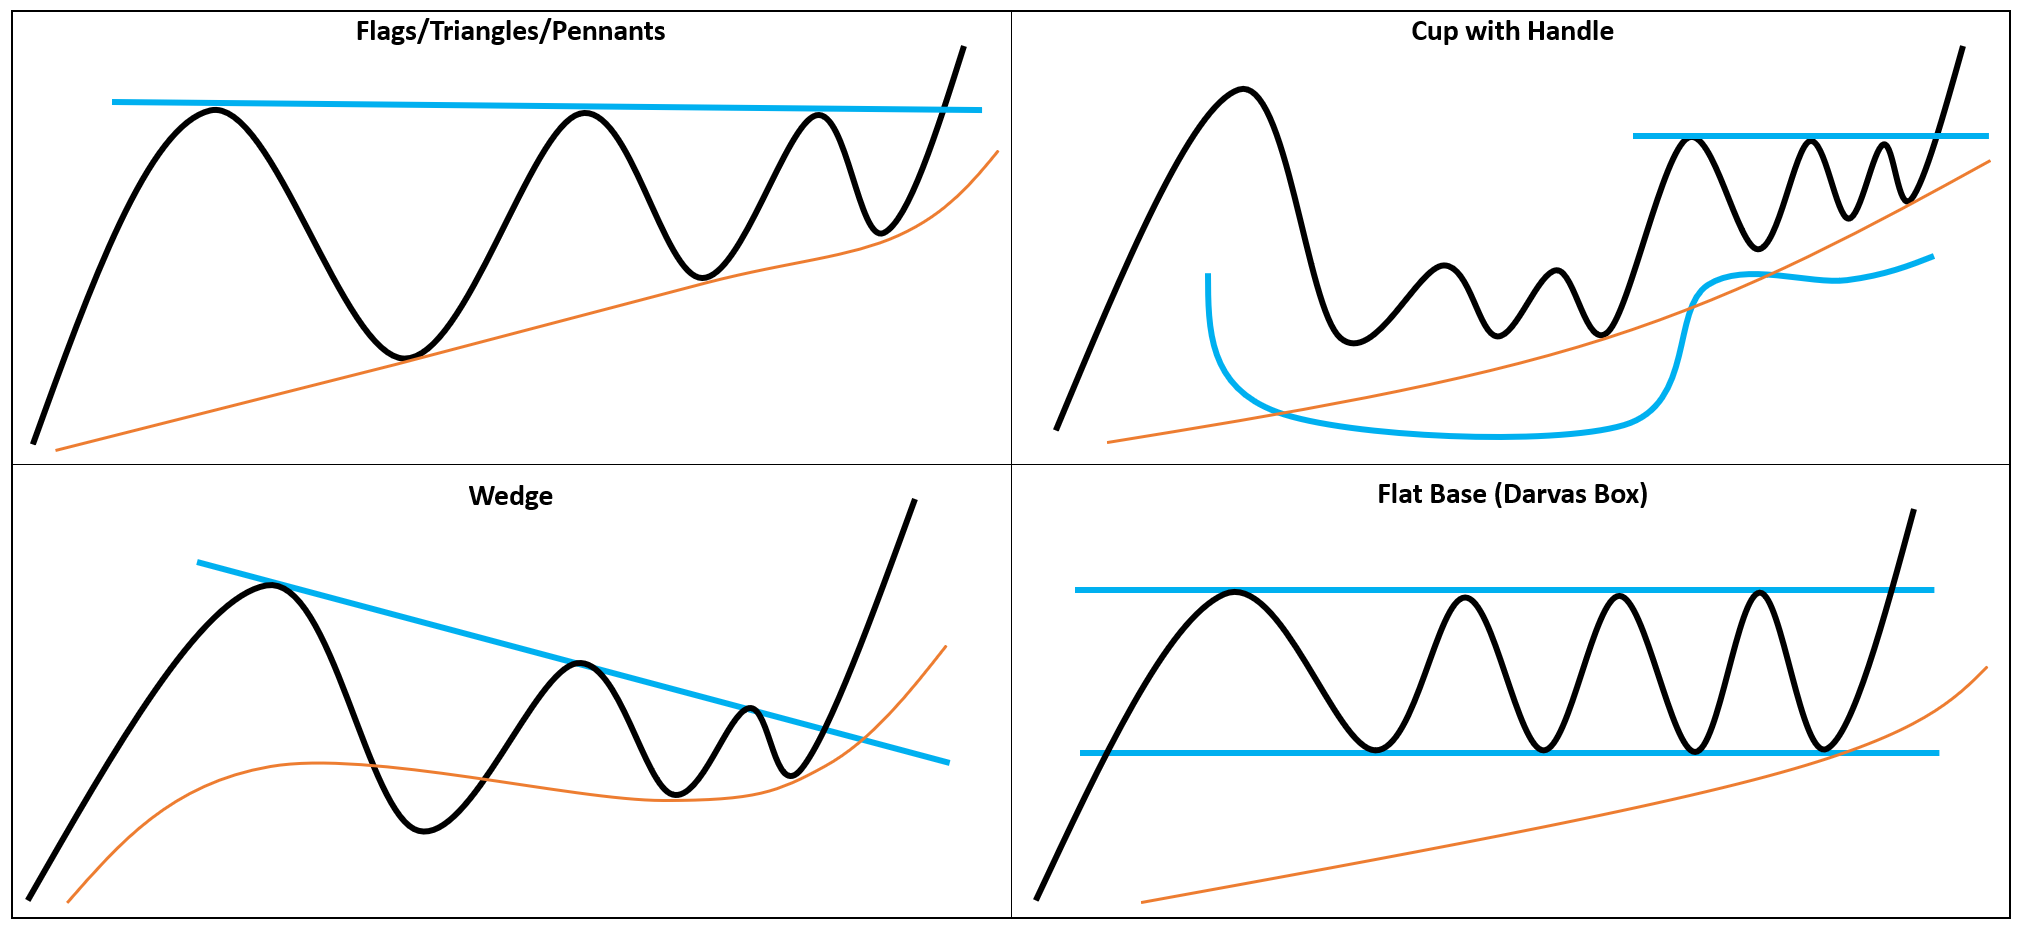
I'm assuming the reader already has an understanding of common price patterns (continuation bases shown in Schematic 1) such as Cup with Handles, Flags, Wedges, Pennants, Channels, Darvas Box, VCP etc. They are also familiar with other aspects of technical analysis such as key moving averages like the 10-day EMA, 21-day EMA, and 50d SMA.
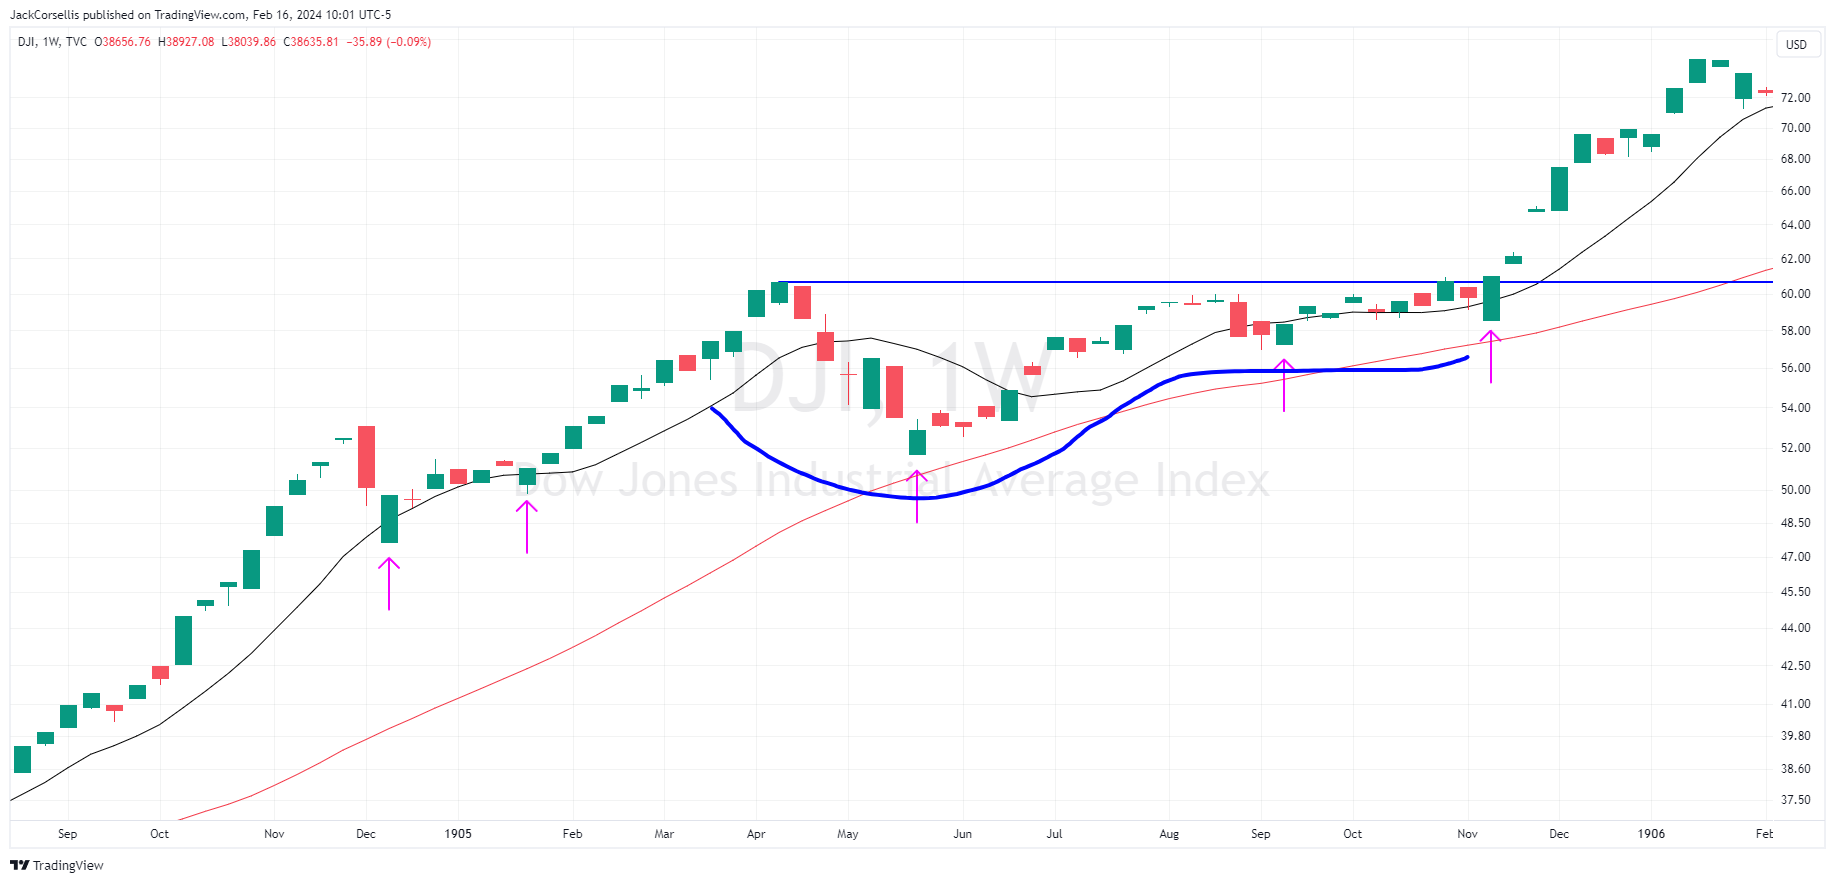
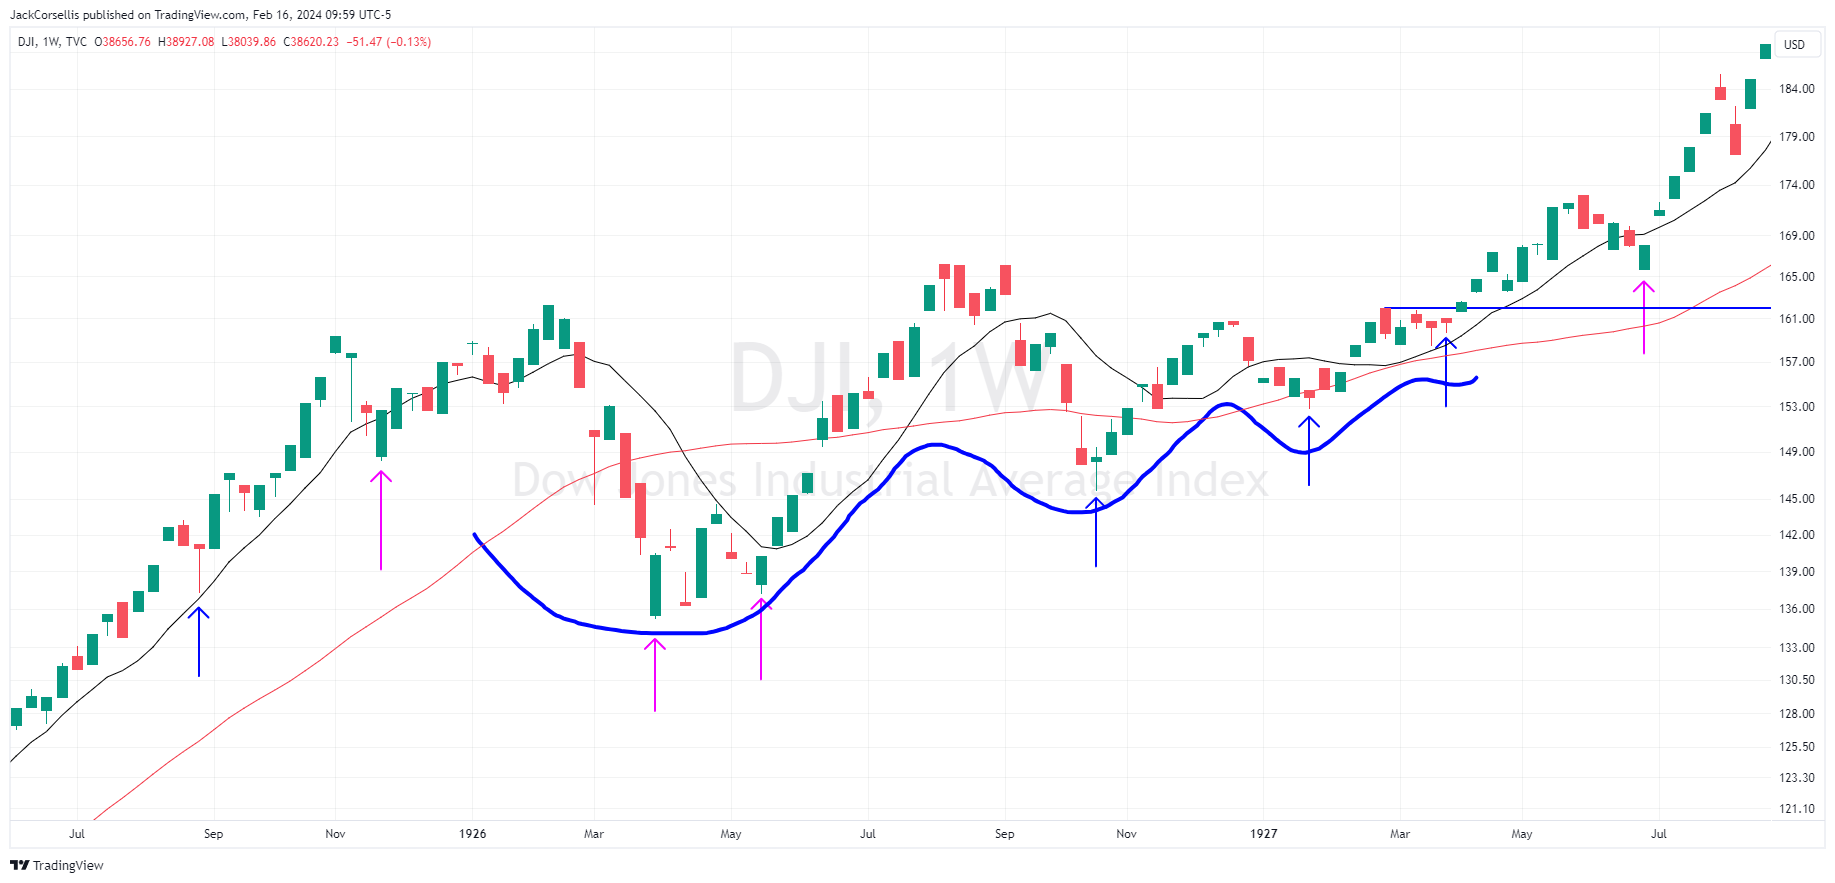
The chart patterns, candlesticks, and moving averages (in my view) are timeless and can be seen on charts from over 100 years ago and today. As can be seen by the weekly charts of the Dow Jones below. The pink and blue arrows are pointing to specific candlesticks you'll learn about in this post called Shakeout Demand Tails & Gap Down Reversals.
There's nothing new under the sun as a famous trading book says!
DJI 1905
DJI 1926/27
Schematic 1:
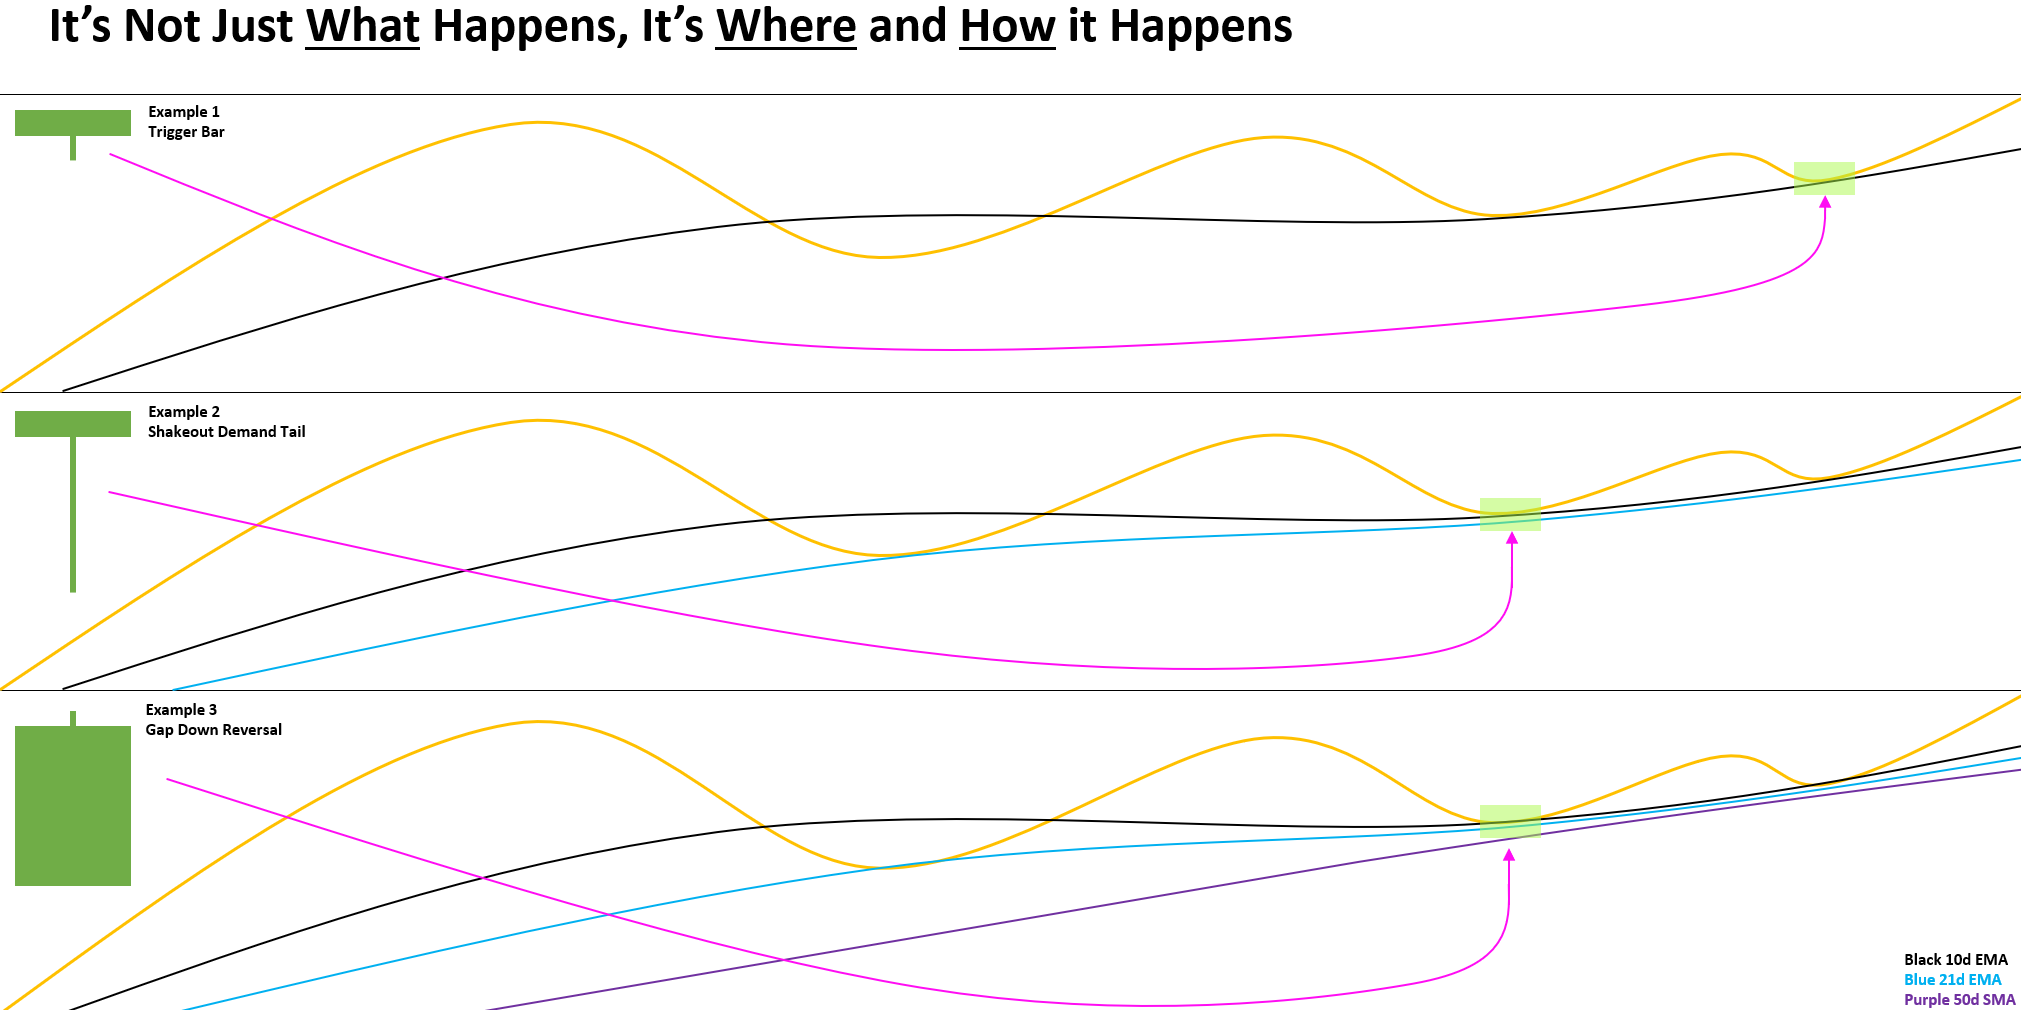
The objective of the post is to provide the reader with optimal entry candlestick data so the entry process can be refined and optimised within these continuation bases. However, it's not just what happens, but where it happens as shown in Schematic 2. The trader is trying to not only identify an optimal entry candlestick (which I call Trigger Bars, Shakeout Demand Tails, and Gap Down Reversal Bars) but also in the context of an optimal continuation base in a leading stock and in the region of a key moving average within the continuation base.
Schematic 2:
Shakeout Demand Tail (SDT) data:
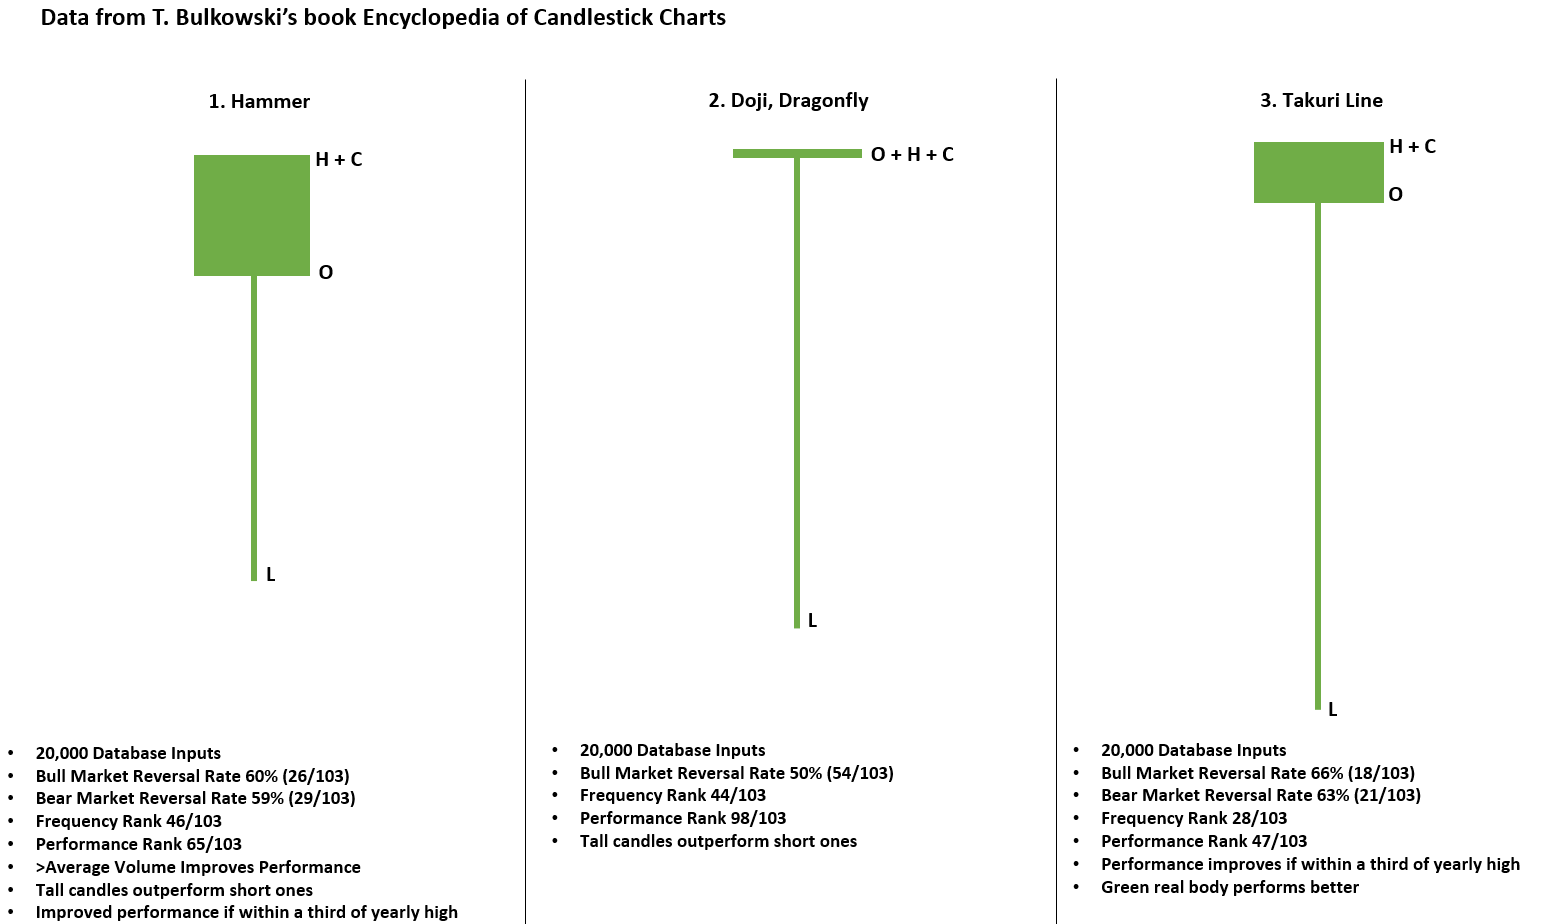
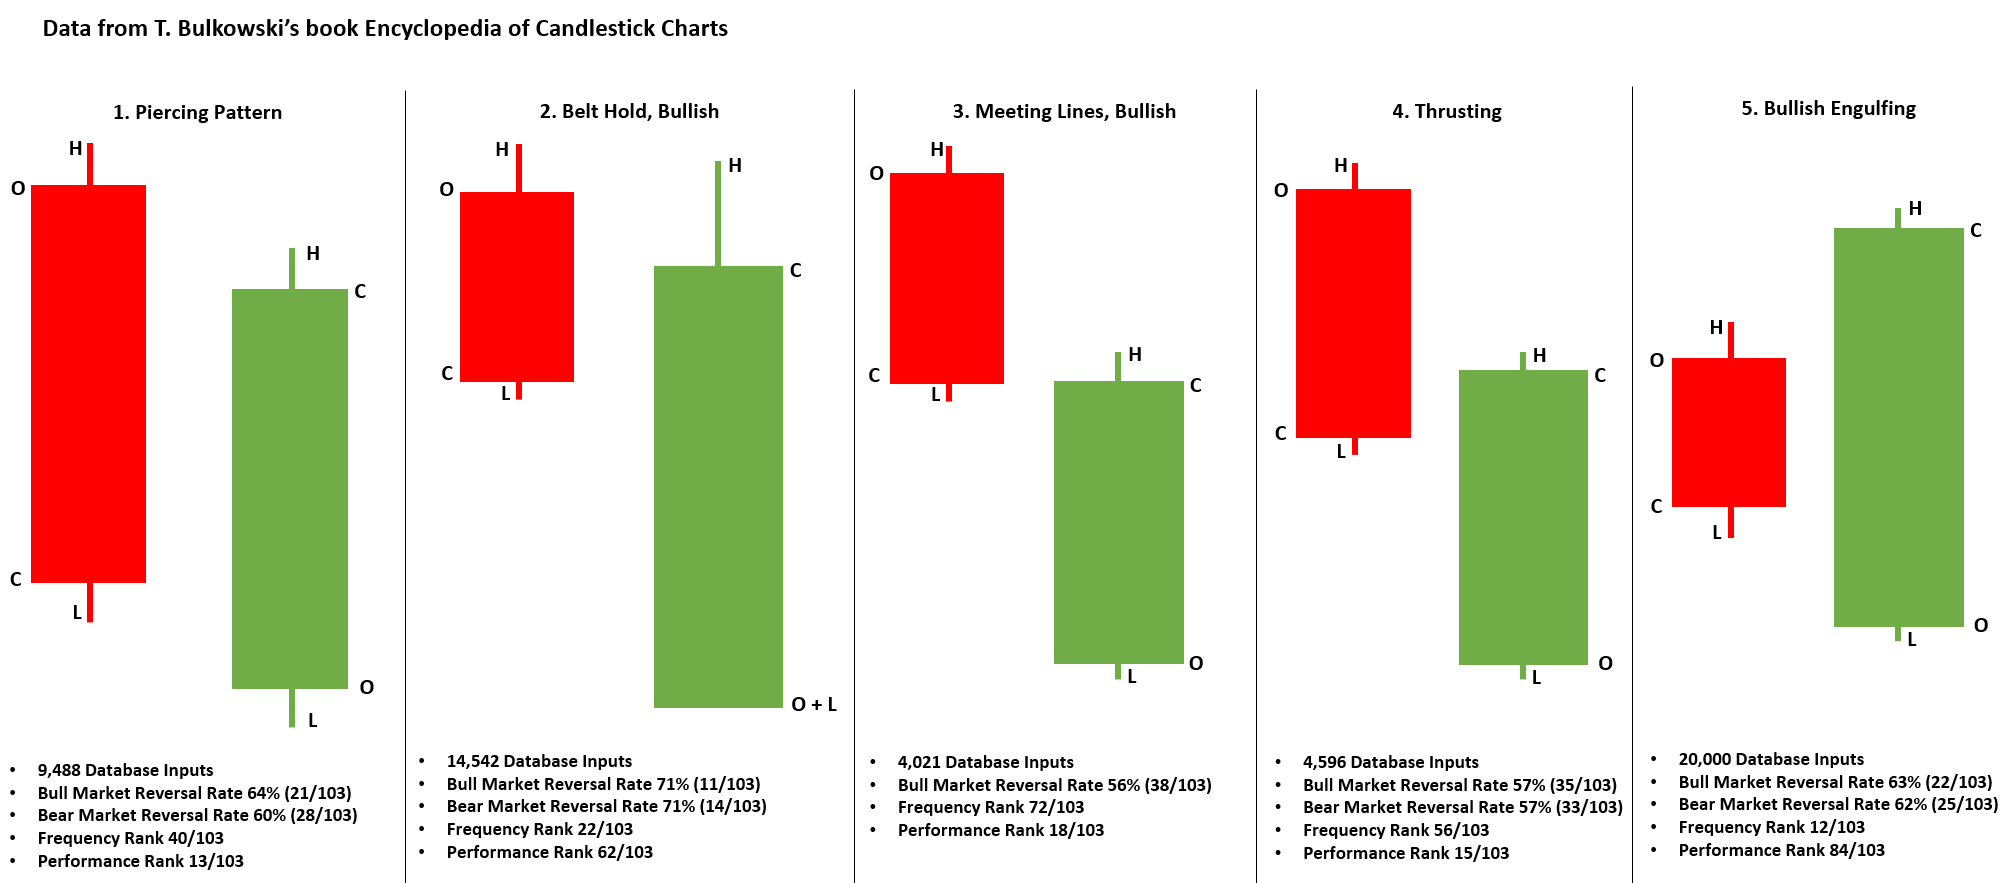
Gap Down Reversal (GDR) data:
Toby Crabel (Trigger Bar) data:
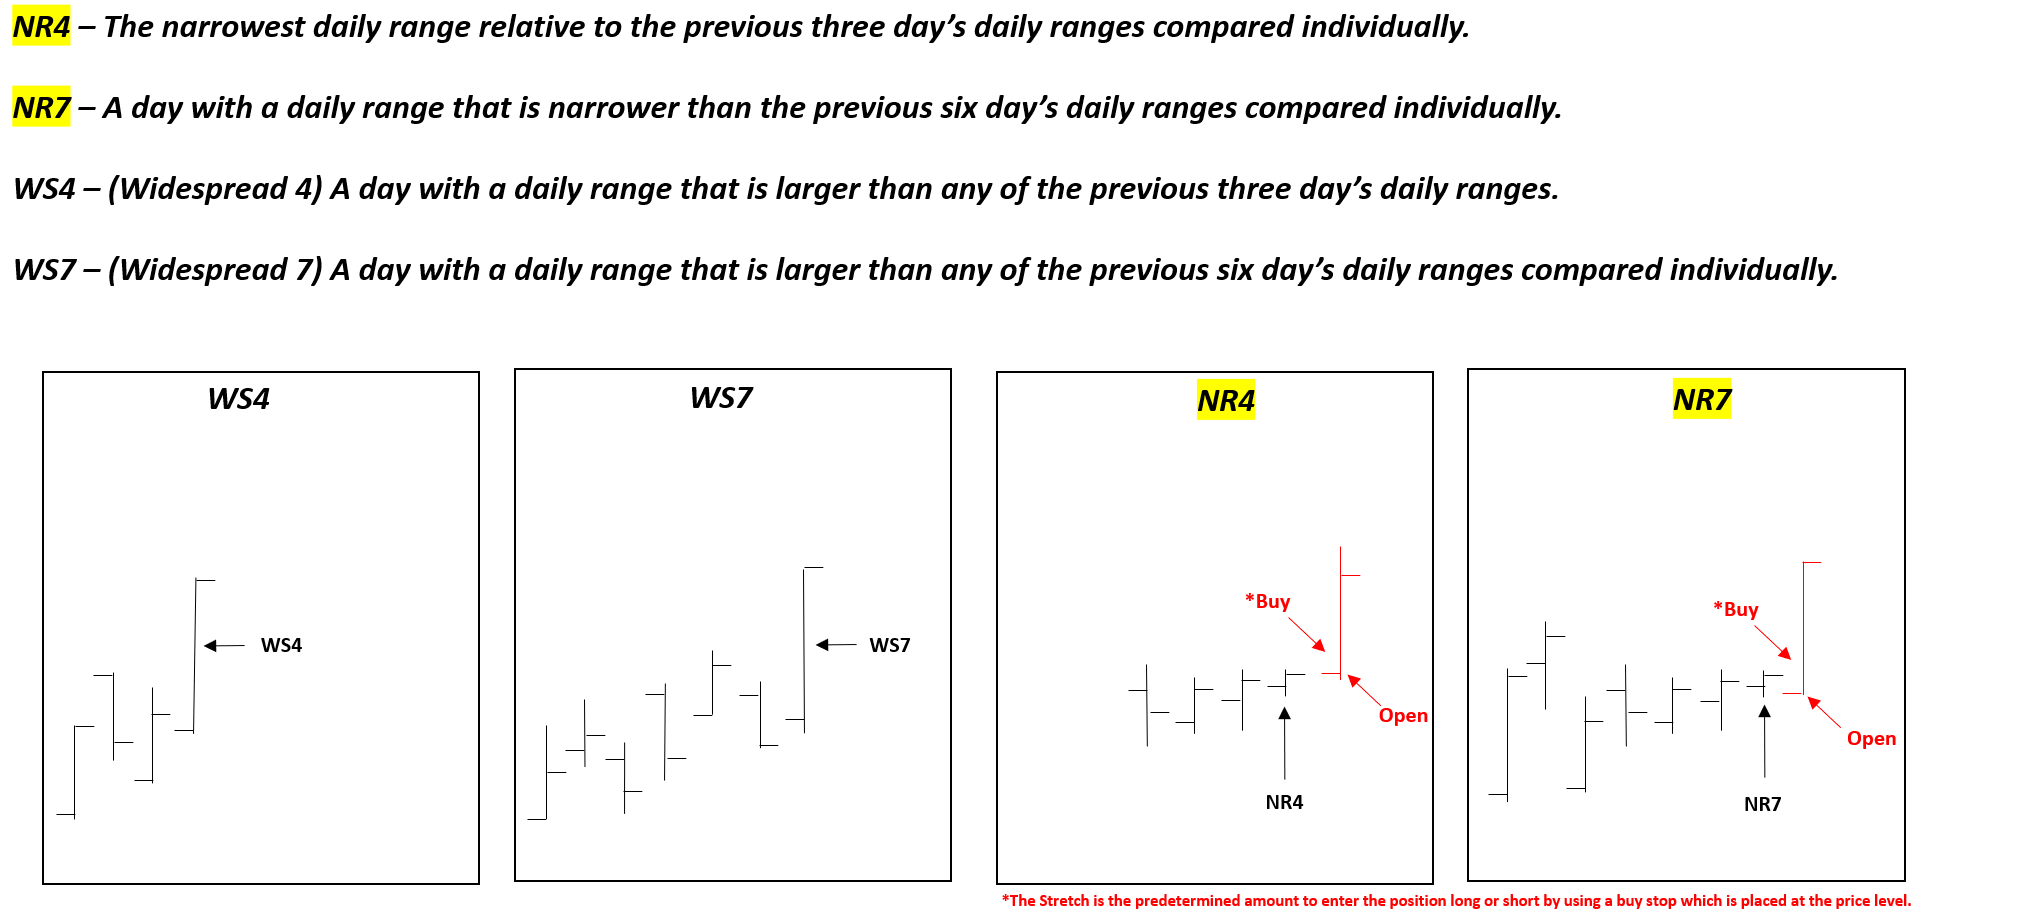
Crabel said in his findings: 'A cumulative total of Gross Profits for the contraction patterns vs expansion patterns on trades in the direction of the move off the open showed $710,000 for contractions on 7,313 trades and $102,000 for expansions on 7,524 trades. Profits were seven times larger for ORB trades after contractions than expansions.'
Toby Crabel on…