Gearing up to fail - how to spot problem companies early

In last week's article, I looked at the benefits they get and the risks they face when companies choose to finance themselves using debt. I introduced tools that will help investors decide that a company has taken on too much debt and is setting itself up for a fall. This week, I describe some more advanced tools that may give early warning signs of financial distress.
Days Sales Ratios
Last week, I suggested that it should have been obvious that the company Beeks Financial Cloud (LON:BKS) required additional equity capital after it released its results to the 31st of December 2021. It is worth noting that this, in itself, is not a problem. Companies are usually listed because they previously required additional equity capital or will need it in the future. Beeks had no problem raising equity capital in April 2022 and did so at a minimal discount. The challenge is that raising equity may be very difficult in the current small cap investing environment, especially if it becomes evident that a company desperately needs it. Many funds are selling to meet redemptions rather than looking to invest further capital.
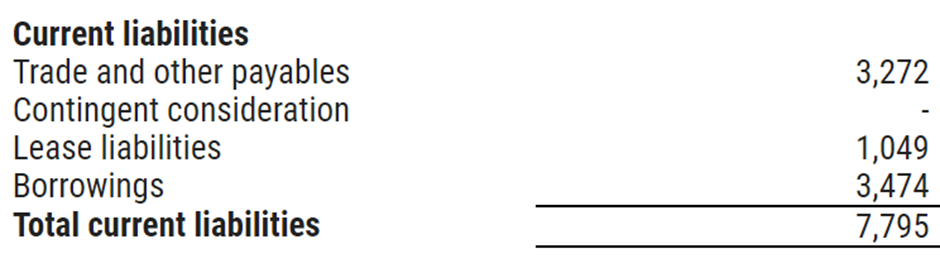
One thing that stood out to me in the Beeks' balance sheet from that time was that trade payables seemed like a large figure for a small company:
But how should investors put these figures into context? Larger companies will tend to have more significant balance sheet entries. The key thing to note is that invoices have an expected timeline for payment. For commercial suppliers, these are normally 90-day terms. So, working out how quickly a company is paying its bills (on average), rather than the absolute value of those, may give a clue as to whether it is in financial distress. This measurement is known as Days Payables Outstanding. This is calculated by comparing the trade payables figure to the Cost of Goods sold over the previous 12 months since this is the amount suppliers will have invoiced. Here is the formula:
Days Payables Outstanding (DPO) = 365 x Accounts Payable/TTM Cost of Goods Sold (COGS)
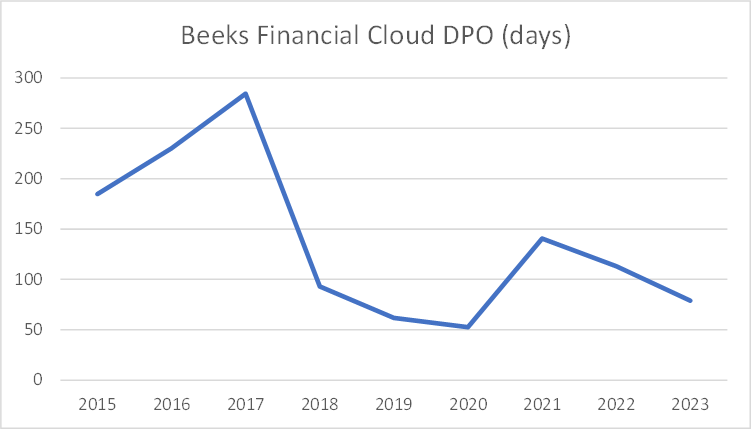
For the year ending the 30th of June 2021, Beeks Financial Cloud (LON:BKS) COGS was £6.59m, and trade payables were £2.54m, making the DPO 141 days. This is higher than standard commercial terms. There may be many explanations for this, and DPO for trailing twelve-month COGS may be distorted by rapid or lumpy growth. However, when combined with the sizeable current debt, this situation should make an investor wary.
There are similar ratios for the other parts of working capital:
Days Sales Inventory (DSI) = 365 x Inventories/TTM Cost of Goods (COGS)
Large jumps in DSI may indicate slow-moving or hard-to-shift stock that will subsequently need to be discounted or written off. And:
Days Sales Receivables (DSR) = 365 x Accounts Receivables/TTM Sales
For these, the absolute values can be less important than spotting significant value changes. Sadly, these figures are not in the Stockopedia data set, so some manual calculation is required. The raw data can be found here:
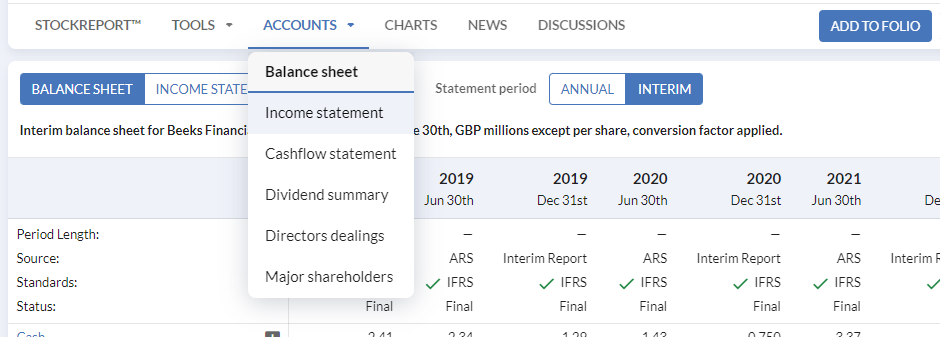
Not every company breaks out their Trade Payables from other payables, such as payroll or deferred acquisition costs, in their interim results. This means that often the analysis can only be done using annual results. Although this may not be as timely, it is still worth doing. A quick copy-paste of the data into Excel and I can easily see the DPO history for Beeks, including the rise from FY20 to FY21. Post-fundraise the DPO has returned to more normal levels:
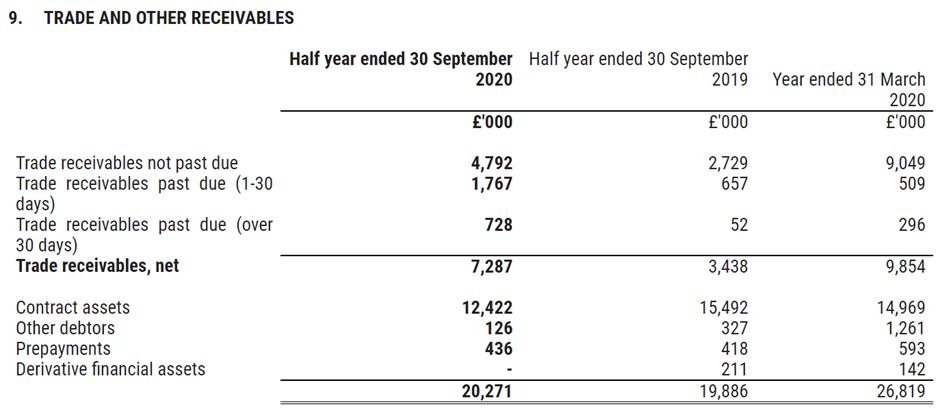
Whereas a rising DPO may indicate a company struggling to pay its bills, a high DSR can indicate potential revenue recognition issues. It is worth paying especially close attention to this metric when a significant amount of these receivables are unbilled. Unbilled receivables are typically lower-quality assets than those that have been invoiced since they often represent an internal opinion of how much work has been done rather than an amount agreed with a customer.
For example, here is the Balance Sheet for the company Tekmar (LON:TGP) on the 30th of September 2020:
And here is the revenue from the same accounts:

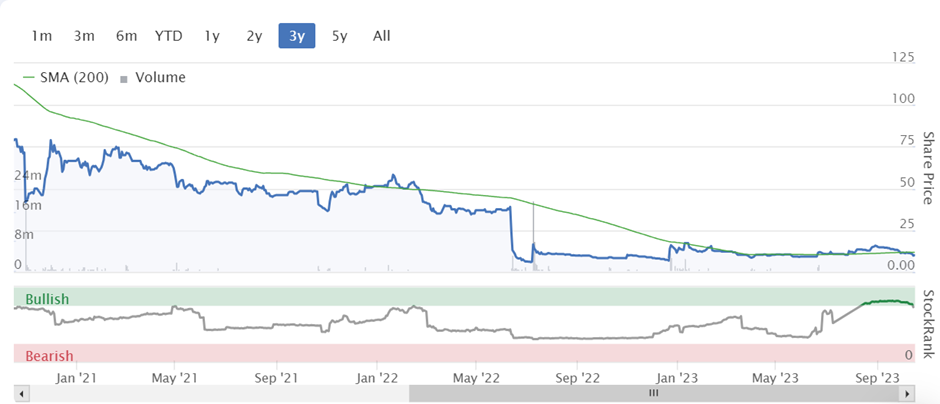
At this point, receivables appear to represent more than six months of revenue outstanding, giving some clue that the share price chart would subsequently look like this:
The other clue is that an increasing amount of trade receivables were overdue. Hence, it is always worth checking a company's annual report for the debtor age profile. Here is an example from Driver (LON:DRV) 's 2022 Annual Report:
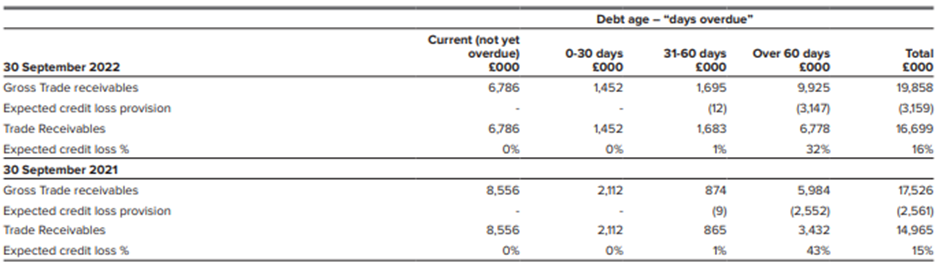
This company did a lot of business in the Middle East, where payment times are always extended. However, the big jump in trade receivables past 60 days due combined with increasing credit loss provision, shows why the company subsequently had to restructure their Middle East operations.
Debt Covenants
The third liquidity ratio Stockopedia provides on the StockReport is called Interest cover.
This is defined as:
Interest Cover = Earnings Before Interest and Taxes (EBIT)/Interest Costs
This metric measures how easily a company can make interest payments on their debt. This is particularly important since it is often one of the covenants that banks put in place as part of the conditions for lending money. Breaching covenants usually means that the debt becomes immediately repayable on demand, something few companies can afford. In practice, banks rarely demand immediate repayment since this would likely put the company into administration. However, breaching banking covenants will give the bank significant input into how a company is run. Banks will undoubtedly block dividend payments or share buybacks to protect their interests. The bank may even demand that the company raise fresh equity as a placing or rights issue to reduce the debt levels.
For many years, interest rates were so low that very few companies had issues meeting their Interest Cover covenant. Now that rates are higher, this figure may well require closer attention. However, the covenant that most companies fail to meet is the Net Debt to EBITDA ratio. This usually happens because weakness in trading means that the reported EBITDA declines too much for comfort.
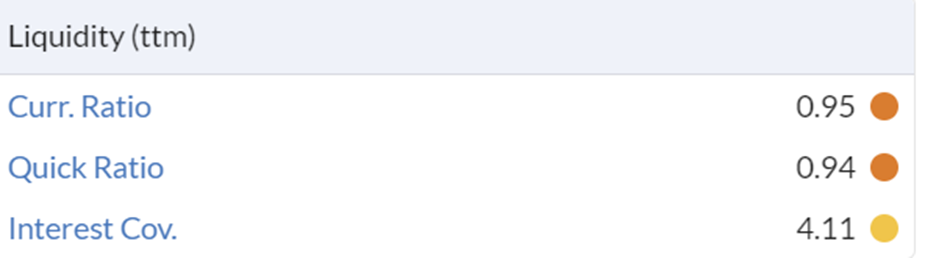
This happened with Aferian (LON:AFRN) this year. Prior to the results to the 30th of November 2023 being announced in May 2023, the current ratio looked weak:
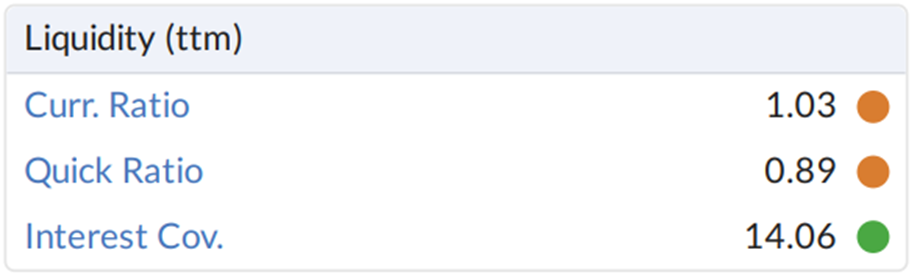
And declined further with these results to 0.97. The Interest Cover also started flashing warning signs:
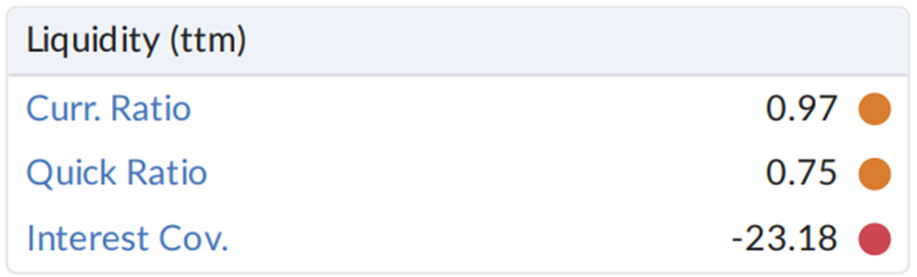
At this point, the company still had net cash. However, the outlook revealed that they had received no material hardware orders for seven months and now had a net debt position:
Following the investment made in inventory within the Amino business, the Group currently has a net debt position, and expects this to continue throughout the current financial year. As previously announced on the 10th of March 2023, we expect Group revenue and adjusted EBITDA for FY23 to be significantly below FY22, albeit that the Group is expected to generate a material positive EBITDA.
Their 28th June Trading Statement revealed the extent of that debt:
Net debt at the 31st of May 2023 was $13.0m (the 31st of May 2022: $7.8m net cash). Net debt is expected to reduce over the remainder of the current financial year as inventory levels reduce. The Group remains in compliance with its loan facilities covenants.
Complying with debt covenants at that point doesn't mean that a company will be compliant in the future. The company promptly raised $4m via a placing. Half-year results released in August showed a $0.1m EBITDA loss and came with the statement:
However, failure to achieve the base case view of forecast sales and reduction in working capital could result in the Group failing to comply with financial covenants associated with its existing bank facility, potentially resulting in the facilities being withdrawn.
So even though the company has remained technically within their covenants, this hasn't stopped the share price from losing almost 90% of its value this year and an emergency fundraise taking place.
Most companies publish their debt covenants in their Annual Report. It is this covenant that has got XP Power (LON:XPP) in trouble, as reported in their recent Q3 Trading Statement:
The Group continues to be in compliance with its banking covenants but is now expecting net debt / Adjusted EBITDA to be close to or above current covenant limits in the near-term. The Group is initiating dialogue with its lenders to seek covenant and liquidity flexibility through the year-end and into 2024.
Their 2022 annual report reveals what the covenants are:
XP secured greater banking covenant flexibility from its lenders in Q4 2022 with the net debt to EBITDA covenant now required to be less than 3.50x in December 2022, 3.25x in June 2023 and 3.0x in December 2023. Group expects to remain well inside these covenants during 2023 and beyond. The greater flexibility also highlights the ongoing support from our lending banks.
The step down in the net debt to EBITDA covenant is perhaps causing the problem here.
However, it also bears considering all aspects of a scenario. Strix (LON:KETL) 's share price fell over 40% recently on a small downgrade in forecasts following its Interim Results. It seems that the following may have done the damage:
Net debt increased to £93.1m (FY 2022: £87.4m) due to the strategic acquisition of Billi. This represents a net debt/adjusted EBITDA ratio (calculated on a trailing twelve-month basis) of 2.66x.
Given the current net debt/adjusted EBITDA covenants are 2.75x, this looks mighty close. With covenants stepping down to 2.25x at the year-end, this looks like another case where the banks will force a placing. There is perhaps one clue that things aren't that bad:
…the Board is declaring an interim dividend of 0.9p per share
The banks have a dividend blocker in place at above 2.5x. So, for this to be paid, the leverage must now be below that level. Management also points out that the Q4 is their strongest operational cash flow period. This remains a risky investment, but the prognosis may not be as bad as the initial figures suggest.
Debt Timing
Finally, the type of debt a company has, and the duration of it are worth paying close attention to. Larger companies may issue bonds whereby the principal is only repaid on maturity, often many years into the future. These, or other long-term fixed-rate bank debt, are usually the best, especially if they have many years left to run. However, when banks provide this type of debt, they often require a repayment schedule, and it is key to ensure the company can easily meet these repayments.
Another downside to term debt is that a company may be unable to make early repayments without incurring a fee, so be left to pay interest on debt while also holding cash. Hence many companies seek more flexible finance. A Revolving Credit Facility (RCF) is the most flexible but least secure form of debt since it can often be withdrawn with little notice. Many companies choose a combination of term debt and a smaller RCF to balance these risks.
It pays to look at big jumps in current debt. This may mean that a company is struggling to refinance their long-term debt. Companies typically like to have new facilities in place up to a year before current ones expire. Any delay in doing this should be considered a red flag. Here is an example of a company that failed to refinance in time. Yesterday, Pressure Technologies (LON:PRES) announced that:
The existing debt facilities of the Group currently comprise a bank loan of £0.9 million provided by Lloyds Banking Group... The Lloyds loan is secured against the assets of the Group and is due to be repaid in full on 31 December 2023 at which point the facility will expire.
Despite being a relatively small amount, the company now say:
As a result, and alongside tightening lending standards and credit availability, the debt capacity of the Group has been restricted and a suitable mainstream lending facility has not been made available.
And two shareholders have had to step in to make the finance available. However, the cost to the company is eye-watering:
An arrangement fee of 3% is payable to the Lenders on drawdown and the Facility carries an interest rate of 14.25% per annum.
Not only are the rates high, but the lenders get 5-year warrants over 5% of the company even if the loan is repaid. Quite a sting in the tail for minority holders.
Summary
The size of a company's debt is important but not the only factor that may mean a company's finances are not robust against a period of poor trading. It pays to look at the overall state of a company's balance sheet, particularly for signs that it may be slow in paying suppliers or too quick to recognise revenue. Investors also need to consider the timing of any debt. A debt that is not due to be repaid or refinanced for many years and whose covenants are light should not pose a problem. However, a large current debt, or debt about to become current because a company will breach its banking covenants, may prove problematic. Some companies may breach their banking covenants but have a supportive bank. Even so, the bank is likely to demand significant reporting from the company, which may drive extra costs in terms of management time or additional interest payments. Banks have a reputation as institutions that would lend you an umbrella as long as it isn't raining. When any downpour starts, they may take it back and demand that the company shelter under a large equity raise instead. In current markets, any such a raise will likely see significant losses for existing shareholders.
[Disclosure: Mark holds shares in Strix (LON:KETL) Driver (LON:DRV) ]
Disclaimer
This is not financial advice. Our content is intended to be used and must be used for information and education purposes only. Please read our disclaimer and terms and conditions to understand our obligations.

8 comments
Another excellent article from the Stockopedia team, have read this several times. You have posted a graph of DSO for Beeks Financial, but you do not mention DSO anywhere else in the article nor provide an equation for it. Is DSO a typing error if not could you explain what it is?
Apologies, this is a typo, should be DPO. Thanks for pointing it out. I have corrected it.
Thanks Mark, an excellent educational article, right now we need this level of knowledge more than anything else.
Timely articles ,thanks Stocko' i certainly need the refreshers.
Thank you Mark. Your articles I need to read a few times! I mean that as a compliment as there’s a lot to digest but really clearly presented. Very timely articles for the small cap investor. Cheers!
Interesting, wouldn't it be nice if we could define our own metrics like DSI or DSR and have them displayed in stock reports?
Is there a way to bookmark or save article for later reading? I can't see a feature to do so. It's difficult to find them later say after a few weeks.
Great read and article, another simple little check I like to use is receipts from customers in the cash flow statement and compare this to revenue/sales from the P&L statement. These two figures should be the same, often there can be a bit of variance due to the different accounting methods used in P&L and the cash flow statements. But if there is a large difference between the two (i.e. revenue/sales far exceeds receipts from customers) then this can be an early sign that sales and volumes are under pressure and if it continues the company is going to have cash flow issues.
In light of Paul Scott's recent comments regarding the importance of examining the balance sheet, this article really adds some flesh to the bones of what to look for. I'm not really one for fundamental analysis but have come to realise that I need to do more in this area; this article will really help me in that regard. Thank you for making what can be a 'heavy' subject not only understandable, but also enjoyable.