Momentum is one of the most robust findings in academic finance. It is clear that, under certain conditions, winning stocks keep on winning and losing stocks keep on losing, but as always, the details matter. A recent comment on one of my articles made me think this would be a great topic to explore further.
What is Momentum?
Not Momentum
There appears to be a recent phenomenon in small cap markets where a beaten-up stock attracts a few buyers, who attract further buyers, leading to some significant short-term gains, only for those to be given back on a profits warning. Perhaps the best recent example is SDI (LON:SDI) :
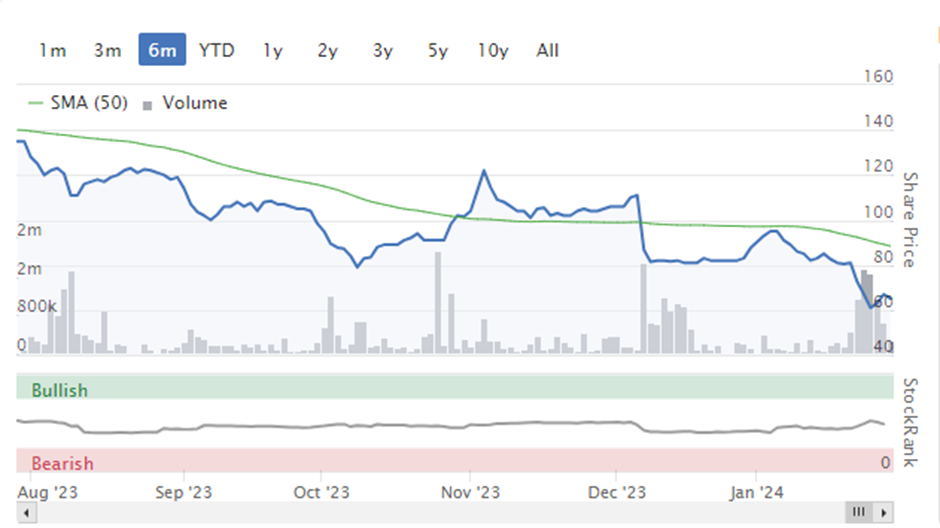
The share price had been weak following results in August 2023, which showed flat adjusted profits and the company taking write-downs on several recent acquisitions. Weak general markets meant the share price bottomed in October at around 80p before gaining around 50% on no further news. A profits warning in December, followed by the CEO leaving in January, means that the shares have subsequently halved. Because Momentum is a common everyday phrase, it is tempting to call the types of share price rise that occurred in October price momentum. However, this wouldn’t be technically correct. These types of short-term effects may be tradable by some. Still, they are certainly not “Momentum” as defined by academic finance (and hence have a robust and repeatable tendency to lead to outperformance.)
Real Momentum
In academia and amongst practitioners, “Momentum” has a precise definition. It is based on the “serial auto-correlation” of stock prices. That sounds complex, but it really isn’t. “serial” means that the correlation is time-based, and “auto” means that stock prices are correlated to themselves and not to some third factor. If the serial autocorrelation is positive, positive share price moves are likely to be followed by positive moves and negative by negative. If the serial autocorrelation is negative, then stock prices are likely to experience what is known as mean reversion and move in the opposite direction.
It was already known by the late 1980s, from the work of Thaler and DeBondt, that stock prices tended to mean revert over very short periods, up to a month. Given the transaction costs, this anomaly is unlikely to be consistently tradable. The same authors also showed mean-reversion over much longer periods, three…