I feel a growing sense of despondency in the discussions while reading the SCVR. It appears that people's portfolios have not been performing well, and the Stockopedia factors that we previously relied upon seem to be losing their effectiveness. Certain comments, such as "fundamental-based factor investing has become less successful," go unchallenged, and even Ed's new series of articles on proven strategies only generate brief and limited discussions. It's possible that factor investing is indeed on the decline, and we may need to explore alternative approaches. With that in mind, I decided to delve into my database and attempt to answer the question: "Have any investing factors been effective in the past year?"
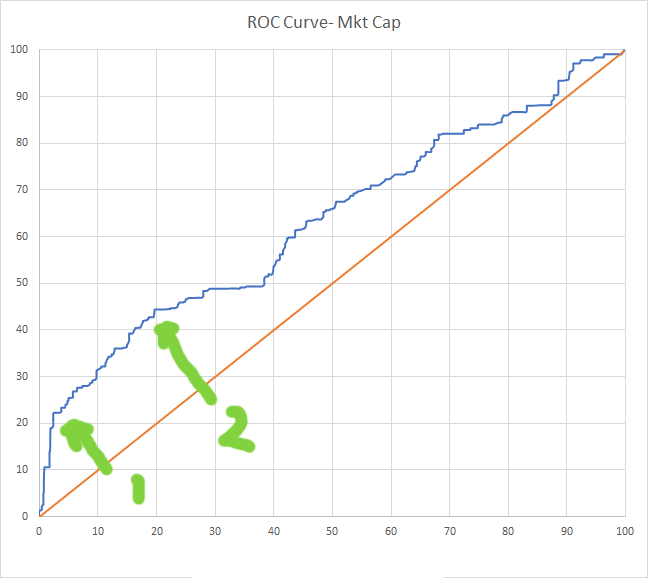
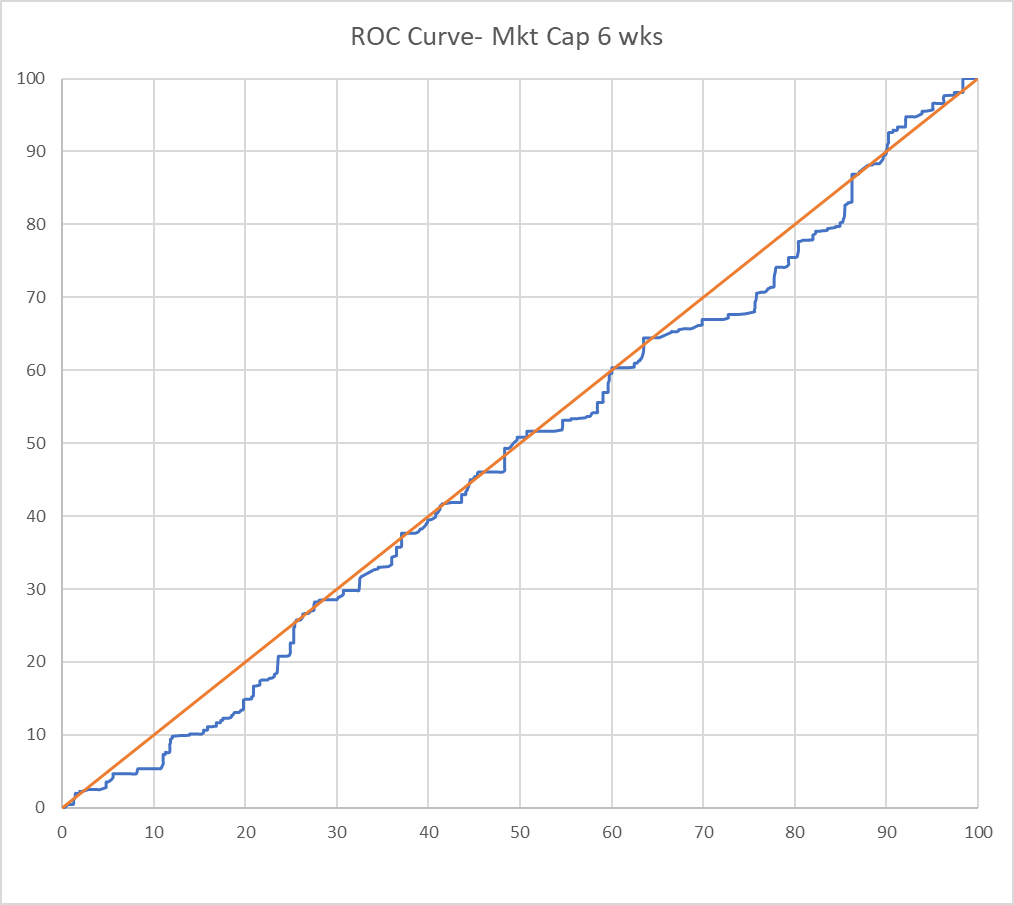
Stockopedia concentrates on three recognised factors with the Quality, Value and Momentum ranks alone or in combination. To these three I have added Size (small cap beats large cap) and Volatility (low volatility is best). I collect data from Stockopedia and over the last 12 months from June 2022 to date I have information on over 680 companies which are part of my investment universe. I have combined a snapshot of this data from 3 June 2022 with total return data from an alternative supplier between that date and now. I then sorted the data according to each of the factors and recorded the average performance of the top and lowest quintiles. I also recorded total return data for various indices over the same time period and calculated the mean total return of all 680 companies.
First, I had a look at the indices and average of all the companies to get a feel for the overall performance. The best return has been from the FTSE 100 with a positive return of 5.1% and the worst from AIM with a real loss of 18.6%. The overall average is a rather poor loss of 8.9% so hardly surprising that most investors aren’t jumping for joy. If we subtract the average from the actual, we get an indication of the relative performance which is graphically illustrated in the bar chart. The star is the FTSE 100 with relative performance of 14.1% and the laggard AIM with the dismal relative performance of -9.7%
% Total Return |
Relative to Average |
|
FTSE 100 TR |
5.1 |
14.1 |