Continuing from last month...
Weighted moving averages
Apart from lowering the number of periods used in its calculation, another way to make a moving average more closely reflect current price behaviour is to ‘weight’ the average calculation. Thus instead of employing a simple average calculation with even weighting given to each bit of price data we could allocate a higher weighting to the more recent price information, as demonstrated in the following formula…
5 Week WMA = 1 x week5 + 2 x week 4 + 3 x week 3 + 4 x week 2 + 5 x week 1
1+2+3+4+5
Where week5 is the oldest week and week1 is the most recent week
Some chartists will play around with this calculation and create their own customized formulas for calculating a weighted moving average (WMA). Note that the weighted moving average follows price activity closer than the simple moving average (of the same period) in the following chart…

Weighted moving averages employ rather cumbersome and complex calculations that would be very time consuming and tedious if they had to be applied manually. However technological evolution means that the chartist can create these averages with the click of a mouse.
Prior to the advent of ‘Computer Aided Drawing’, chartists only used simple moving averages. But weighted moving averages haven‘t completely replaced simple moving averages today because each type of moving average has its own strengths and weaknesses. Thus, simple moving averages are actually more commonly used in crossover strategies than weighted moving averages because they have more lag (not less), which is preferable for these charting techniques.
Exponential moving average
The most commonly used type of weighted moving average is the exponential moving average (EMA). The calculation for an exponential moving average is so complex that it only came into existence after chartists began using computers and charting software.
EMA = Today’s Price x K + Yesterdays EMA x (1-K)
Where K = 2 / (Total Number of Days + 1)
An EMA has a very similar shape to a WMA, as can be seen in the following comparison chart…
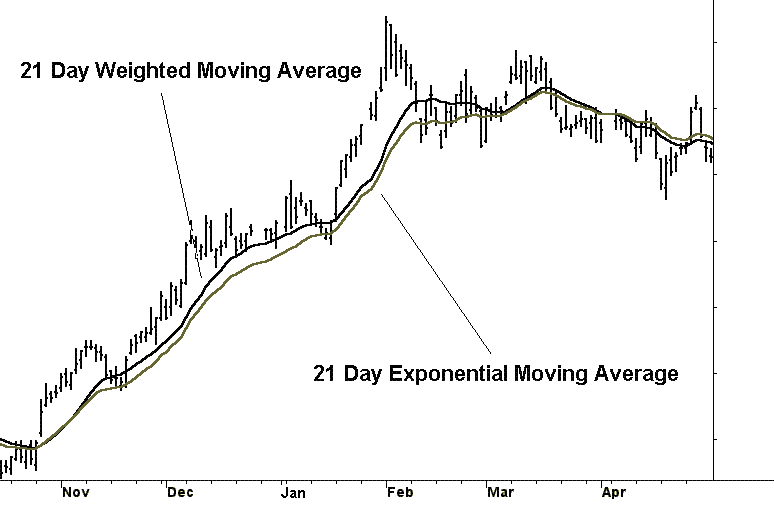
And whilst an EMA is less responsive than a WMA of the same period,…