This it the final Alan Hull Tutorial on the topic. For more information please consider visiting Alan's website to learn more.
Momentum and the MACD indicator
Price momentum
One of the more esoteric aspects of charting is the concept of price momentum. Price momentum is essentially the rate at which price activity rises or falls. So if price activity is rising very fast then a chartist would say that it has a lot of upward momentum or if it were falling rapidly then it would have a lot of downward momentum. This all sounds reasonably simple but just to complicate things slightly, it’s the ‘rate of change’ of price momentum that chartists are actually interested in.
This is best explained with the help of a chart where we can apply two different moving averages and observe how they interact with each other. Take the following chart where I’ve applied both a 12 period and a 26 period exponential moving average. Of course the 12 period EMA is the black line which is sitting closest to the price activity. Now look at the distance between the two averages and how it increases as price activity accelerates upwards and then decreases as it begins to flatten out.
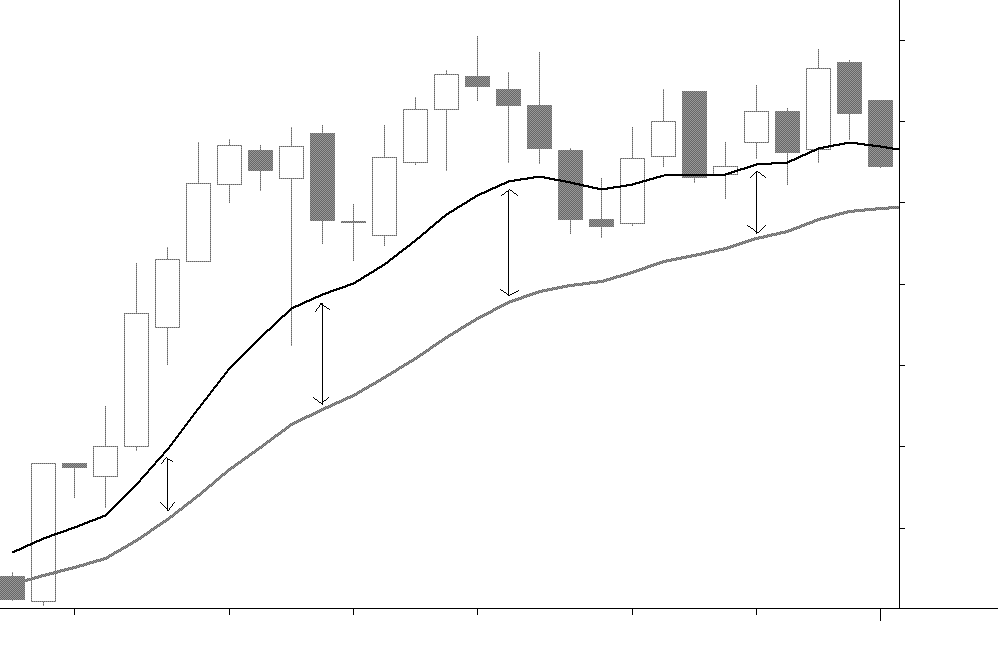
This distance is directly related to the gradient of the trend and is therefore a representation of price momentum. So as this distance increases it means that the momentum is increasing and when it decreases then momentum is decreasing. And as we’re primarily interested in the change in momentum; the actual distance being measured is of little significance whereas the ‘change’ in this distance is very important.
Of course the distance between these two lines can be easily worked out by simply subtracting one from the other. This is done by subtracting the 26 period EMA, the slower of the two moving averages, from the 12 period EMA, the faster moving average. We can then display this value as a line in what we call a sub chart or sub window at either the top or the bottom of the price chart.
This value will vary along with any change in price trend and so will allow us to easily observe the change in momentum. The following chart shows both the 12 period and…