I've been wondering for a while why the Director Deals indicator on the Stocko report page seems often to mislead.
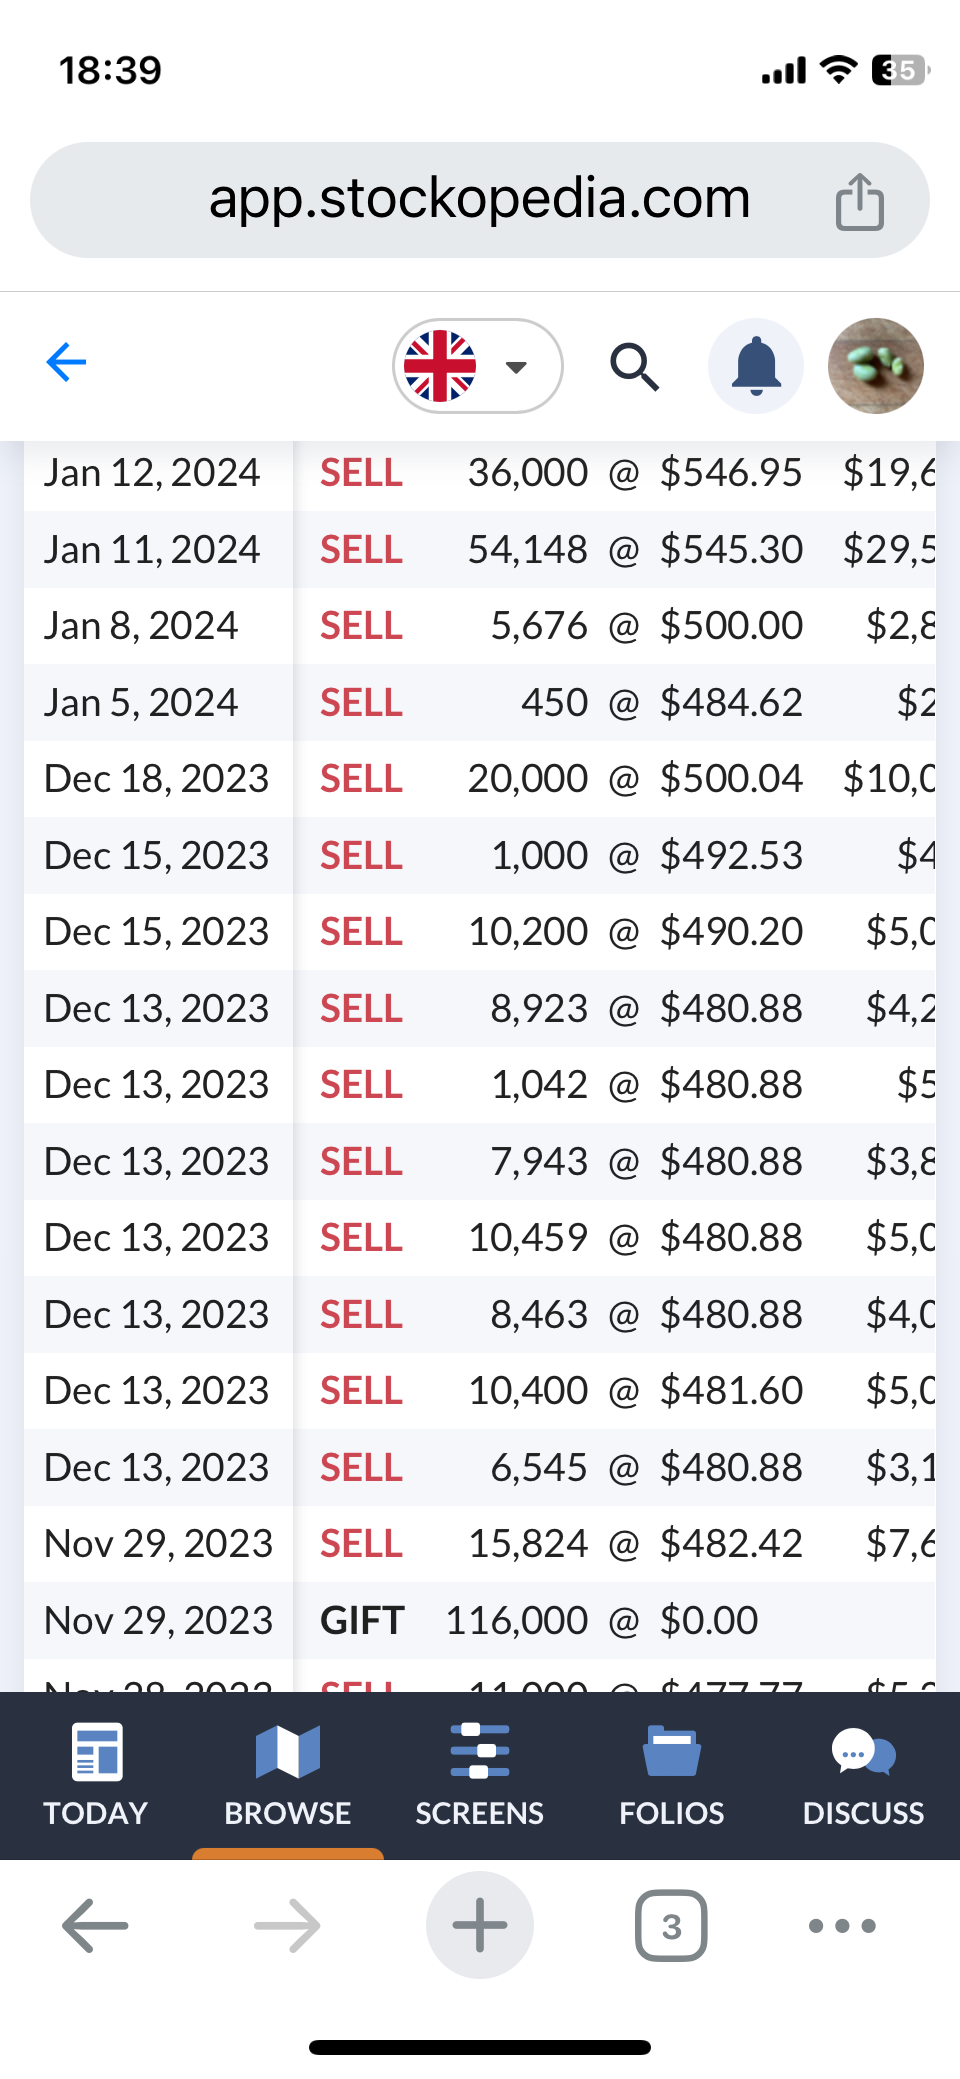
For example, if I look at NVIDIA (NSQ:NVDA) the Stock Report page shows a tiny thin red line only, implying that hardly any Director sales have happened. But if I then click on this and look at the deals themselves I see an ocean of Director Sales in Nvidia. The last Director purchase was in 2020.
Why is the Red/Green indicator so inacccurate? Thanks...