Computershare (ASX:CPU) is one of the highest quality stocks on the ASX with a Quality Score of 99. It began life as a share registry business in Australia, but now derives most of its income from the USA. They listed in 1994 with a market capitalization of $36 million and over the last 30 years have grown to be the 33rd largest stock on the market with a market capitalization of $15.6 billion. Whilst still deriving a large portion of their revenue from share registries, they also offer employee equity plans, stakeholder communications, corporate governance, fund services and deposit protection.
The high Quality Score is a result of high returns on capital and equity, high margins, and a perfect Health Trend score. FY23 was a particularly strong year for CPU however they have been a consistently strong performer for a long period of time.

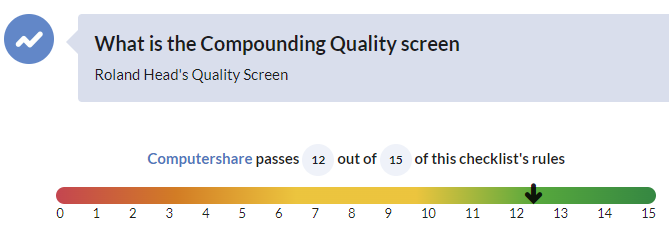
As demonstrated by their growth over the years, they have also been a solid compounder of returns. More specifically, looking at the Quality Compounding screen as devised by Roland Head, CPU doesn’t quite make the grade, however it meets 12 out of 15 criteria, and of those it misses, it is only by a small margin.
Digging into the details (as shown in the table below), we see that margins, cash flow and sales growth are strong. Long-term return on capital employed is below the threshold of 18% but still very healthy at 11.5%. The long-term average cash flow yield also fell short of the 8% threshold but given that for most of the last five years we were in a very low interest rate environment, a return of 6.6% is still solid. In terms of the balance sheet and debt servicing, whilst it is not as conservatively managed as some companies, an interest cover ratio of 5.7x certainly does not set off alarm bells.
Criteria | Threshold | CPU |
QualityRank | 80 | 99 |
Long-term ROCE | 18% | 11.5% |
TTM ROCE | 15% | 15.2% |
Operating margin 5 yr avg | 10% | 18.1% |
Operating margin TTM | 10% | 23.0% |
Net margin 5 yr avg | 8% | 11.8% |
Net margin TTM | 8% | 13.9% |
OCF / EPS | 0.8 | 0.9 |
Avg FCF (long term) / Assets | 8% | 6.6% |
Sales CAGR 5 yr | 0% | 6.9% |
Sales TTM / Sales Prior TTM | 5% | 24.8% |
Debt to assets | <50% |