In this post I look at the FTSE 100’s current CAPE (cyclically adjusted PE) valuation and then use that to make a short-term forecast for 2018 and a long-term forecast for 2027.
Is the FTSE 100 expensive?
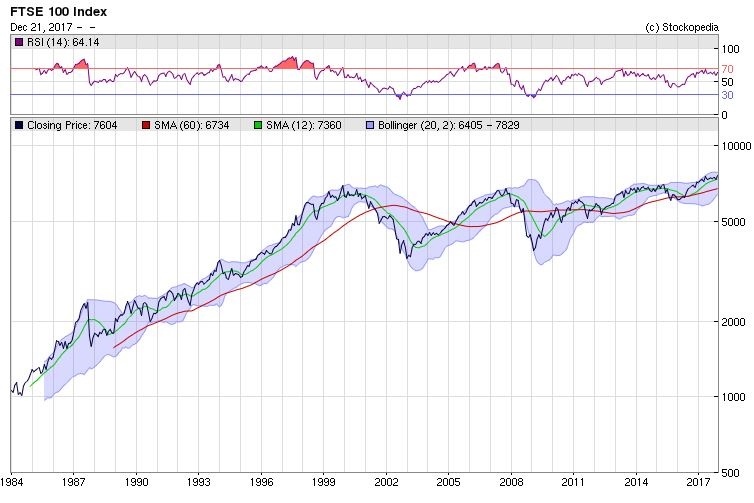
The large-cap index has repeated hit all-time highs during 2017, and at a current price of 7,550 it sits only a few points below its highest ever closing value of 7,562.
This is why many investors think the index is expensive.
On top of that, for 20 years or so the FTSE 100 has repeatedly failed to sustainably exceed 7,000. When it’s reached that level in the past, it has subsequently fallen dramatically as the chart below shows:
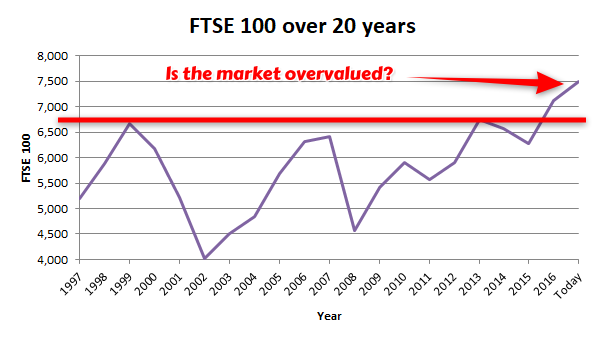
This is a worrying picture. If history is anything to go by, it looks as if the FTSE 100 is probably going to collapse any moment now and plunge back below 5,000.
That is a reasonable interpretation of the past, but if we look at the past 30 years rather than the past 20 years, the picture changes dramatically:
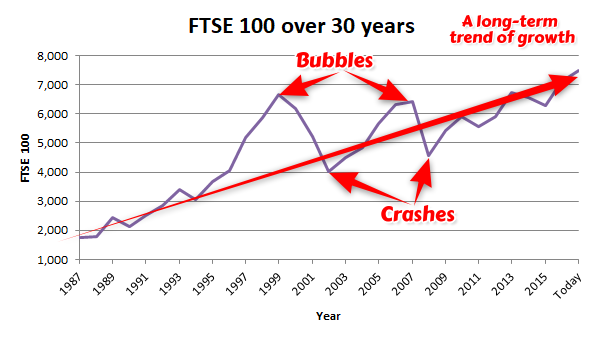
Here we can see that the “resistance” which exists at the 7,000 level is simply a temporary anomaly caused by two successive bubbles (one in tech stocks one in housing and banks).
In other words, the 7,000 level is irrelevant and what really matters is that long-term growth trend (which, in case you were wondering, is driven by a combination of inflation and real economic growth).
In terms of valuation, we can assume that the trend line is approximately “fair value” for the FTSE 100.
The chart above then clearly indicates that the FTSE 100 was expensive at the end of 1999 and 2007 (after which the index collapsed) and cheap at the end of 2002 and 2008 (after which the index skyrocketed).
- Today the FTSE 100 is very close to its long-term trend line, suggesting the index is close to fair value despite also being close to its all-time high
Of course, this is just one way to analyse the market’s value and there are other, perhaps better ways.
Is the FTSE 100’s CAPE ratio high or low?
CAPE uses ten-year average earnings which are far more stable than annual earnings, and it adjusts them for inflation too. The result is a much more stable ratio than the standard PE ratio and that's why CAPE is my preferred valuation tool for…