As UK readers will know, I’ve been running the systematic NAPS Portfolio on UK stocks for many years. The NAPS is my “no admin portfolio system”, based on the StockRanks, which takes less than an hour to put together every year. In spite of its simplicity, it has returned almost 15% annualised in the UK and beaten all but 4 out of 275 UK Equity Investment Funds over the last five years.
In essence, the strategy buys the top 2 ranked stocks in each of our ten economic sectors and holds them for a year. Then it does the same thing the year after, rebalancing into a new set of high ranked stocks across sectors and holding again for the next year. Rebalance, Hold, Repeat.
Common questions I receive are on this theme are around whether this strategy “works” internationally:
- “how does the NAPS perform in {country}?”
- “can you publish a NAPS for {country}?”
While it’s too much for me to publish a written NAPS portfolio for every country we cover, I have spent some time building a system to test the strategy in other markets. We’ll start with the USA.
First, some context - Value has struggled in America
Many will be aware that while momentum has fared well in America in the last decade, value has suffered and it is only in the last couple of years that it has bounced back. By “value” I mean stocks that are cheap on historic measures of valuation. Over the last hundred years value investors, who hunt in the bargain bucket of the market, have done very well. There has been a persistent, profitable return to buying cheap stocks which has become known as “the Value Factor”.
But the Value Factor struggled since the global financial crisis as a surge of liquidity drove capital into momentum stocks. As the StockRanks contains an equal weighted blend of Quality, Value and Momentum measures, the performance of 80+ ranked shares has struggled against the S&P 500. As can be seen below - the 80+ ranked shares (green line) has underperformed the S&P 500 (blue).
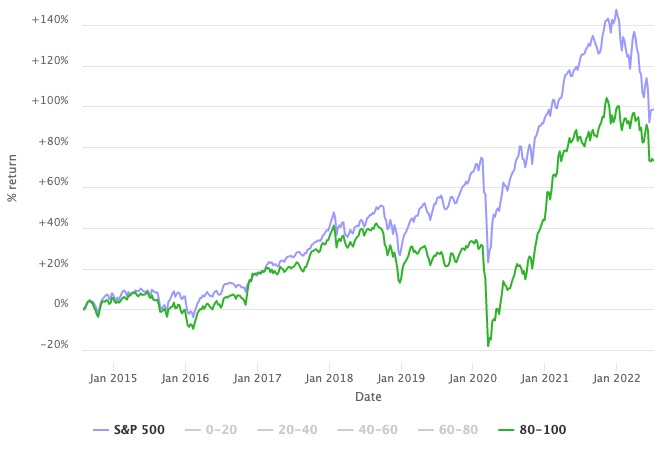
But thousands not a portfolio be
Of course, the green line above is composed of probably 2,000 shares at any one time, and those shares are unevenly distributed across sectors and industries. As a private investor…