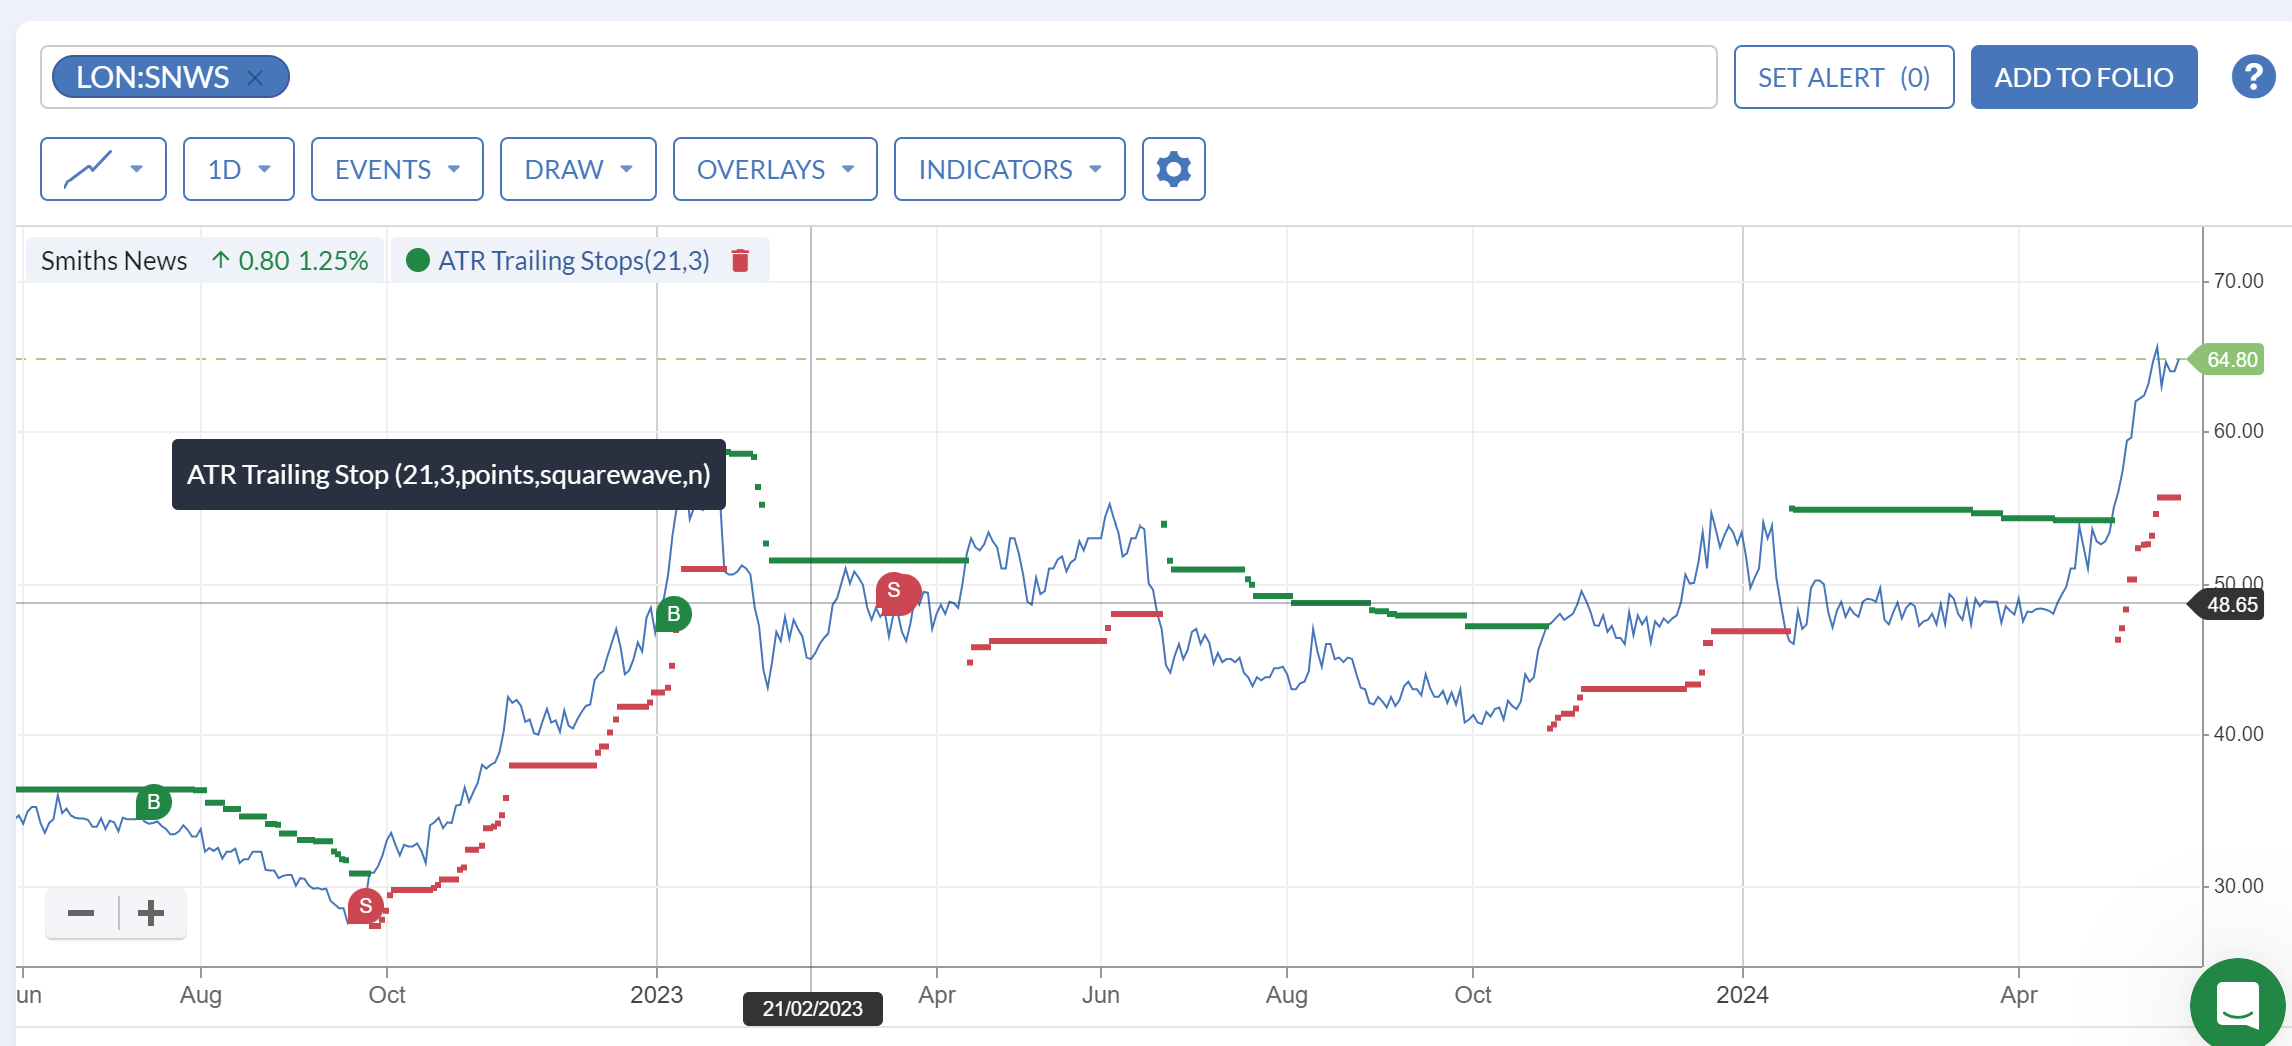
I am interested in how the stop loss lines (green & red in image below) are calculated,
As I understand things, the True Range would be calculated on a daily basis as the greater of:
1) High - Prior Close
2) Prior Close - Low
3) High - Low
You then take the max of 1-3 above and that is the True Range for the day. You would then take the average of the previous 21 days to get the ATR and multiply this number by 3.
Assuming the above is correct, I think I am just missing the last step which is how I get from this to a marker on the chart. Presumably I am applying the ATR above to a moving average of some sort. Can anybody help?