UK-listed asset managers delivered strong returns in Q4-23 (they have been for well over a year now). But clients are still pulling money out. Flows surely follow strong returns? But when?
[This is not investing advice - please read the disclaimer here.]
Asset managers had a good Q4 of 2023, with most recording solid AUM growth.
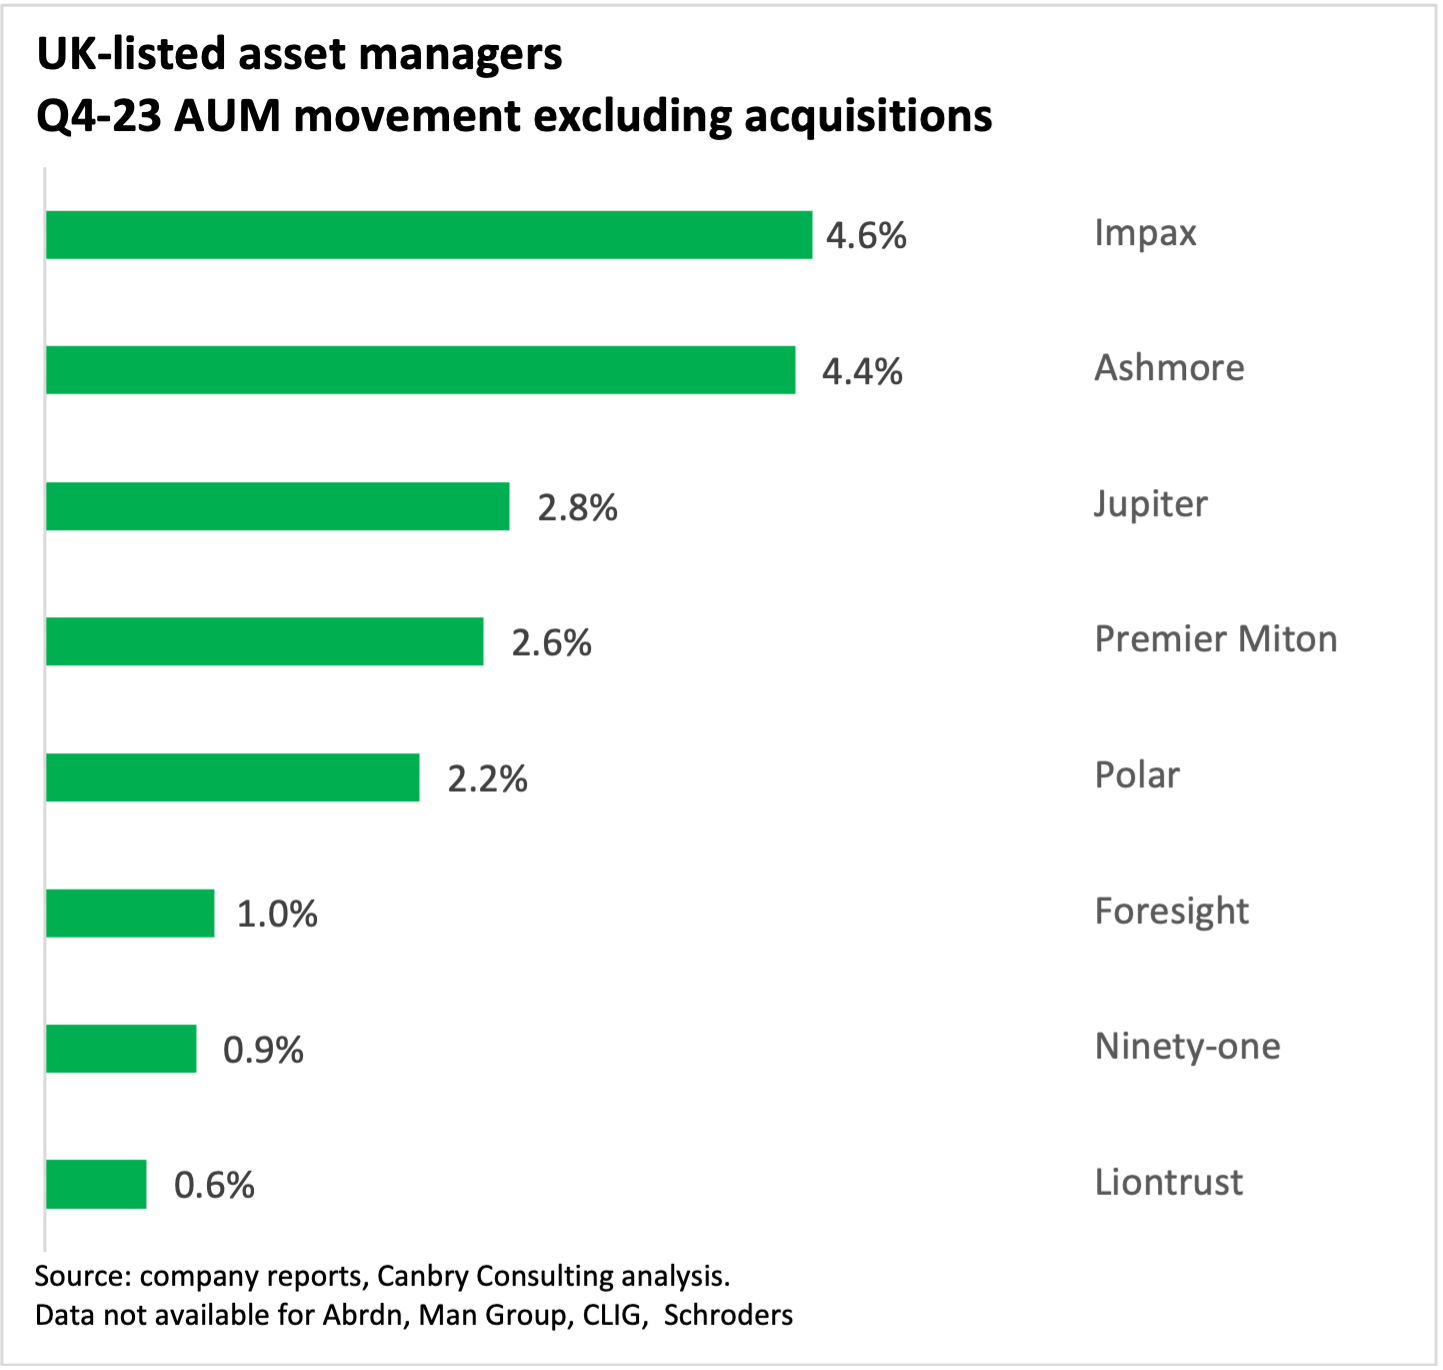
The growth story was however all about market movements and investment returns, with most major indexes sharply up (MSCI AWCI: +11.2%; S&P 500: +11.2%; NASDAQ: +13.6%; FTSE 100: +1.7%).
[Note that returns for the first three indexes above are show in US$ terms, and those UK asset managers reporting AUM in GBP (all except Ashmore in the above chart) would have had a currency headwind on their USD holdings of around 4% in Q4 23 as the GBP/USD rate moved from 1.22 to 1.27 over the quarter.]
Meanwhile, investors remained nervous and continued to withdraw money from asset managers.
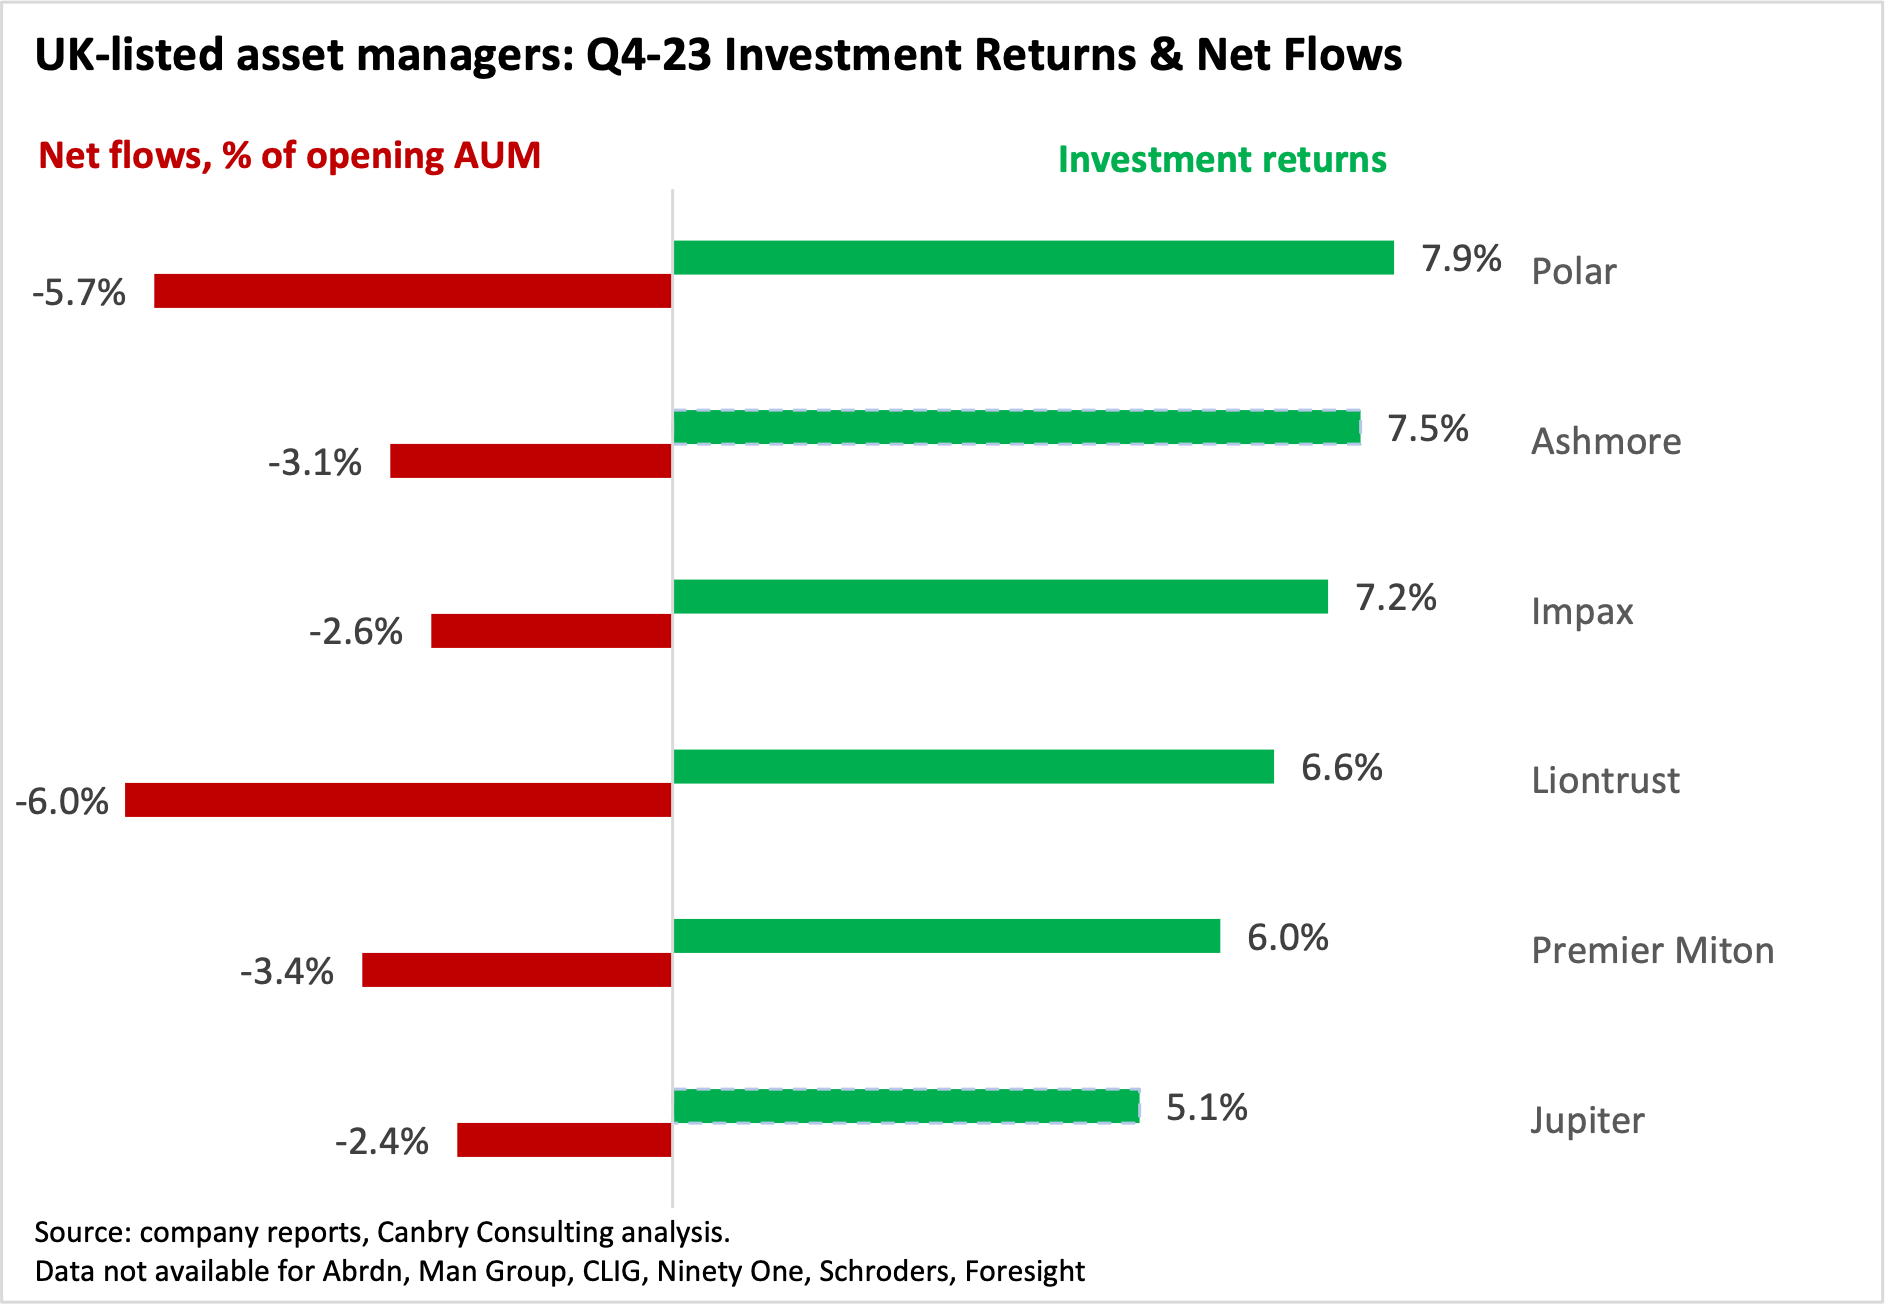
The net withdrawal of funds from most of these asset managers has been going on for two years now, starting in early 2022 (the middle section of the bottom chart in the graphic below) when markets started to tank (the middle section of the top chart in the graphic below).
We don’t know exactly where most of that capital has gone, but it has been widely mooted by asset managers that most of the outflows are asset allocation decisions out of equities and into cash or fixed income assets.
If that is the case, then the timing of recent withdrawals by asset managers’ clients isn’t looking like such a smart decision. They’ve been pulling funds and missed a strong rally. In the top chart below, look at the plethora of green bars to the right of the chart (since Q4 22) indicating mostly positive (and very strong) investment returns (with the exception of Q3 23). And then contrast that to the plethora of red bars in the bottom chart over the same period, indicating quite strong net outflows, and hardly different from the carnage of 2022. There’s a massive mismatch.
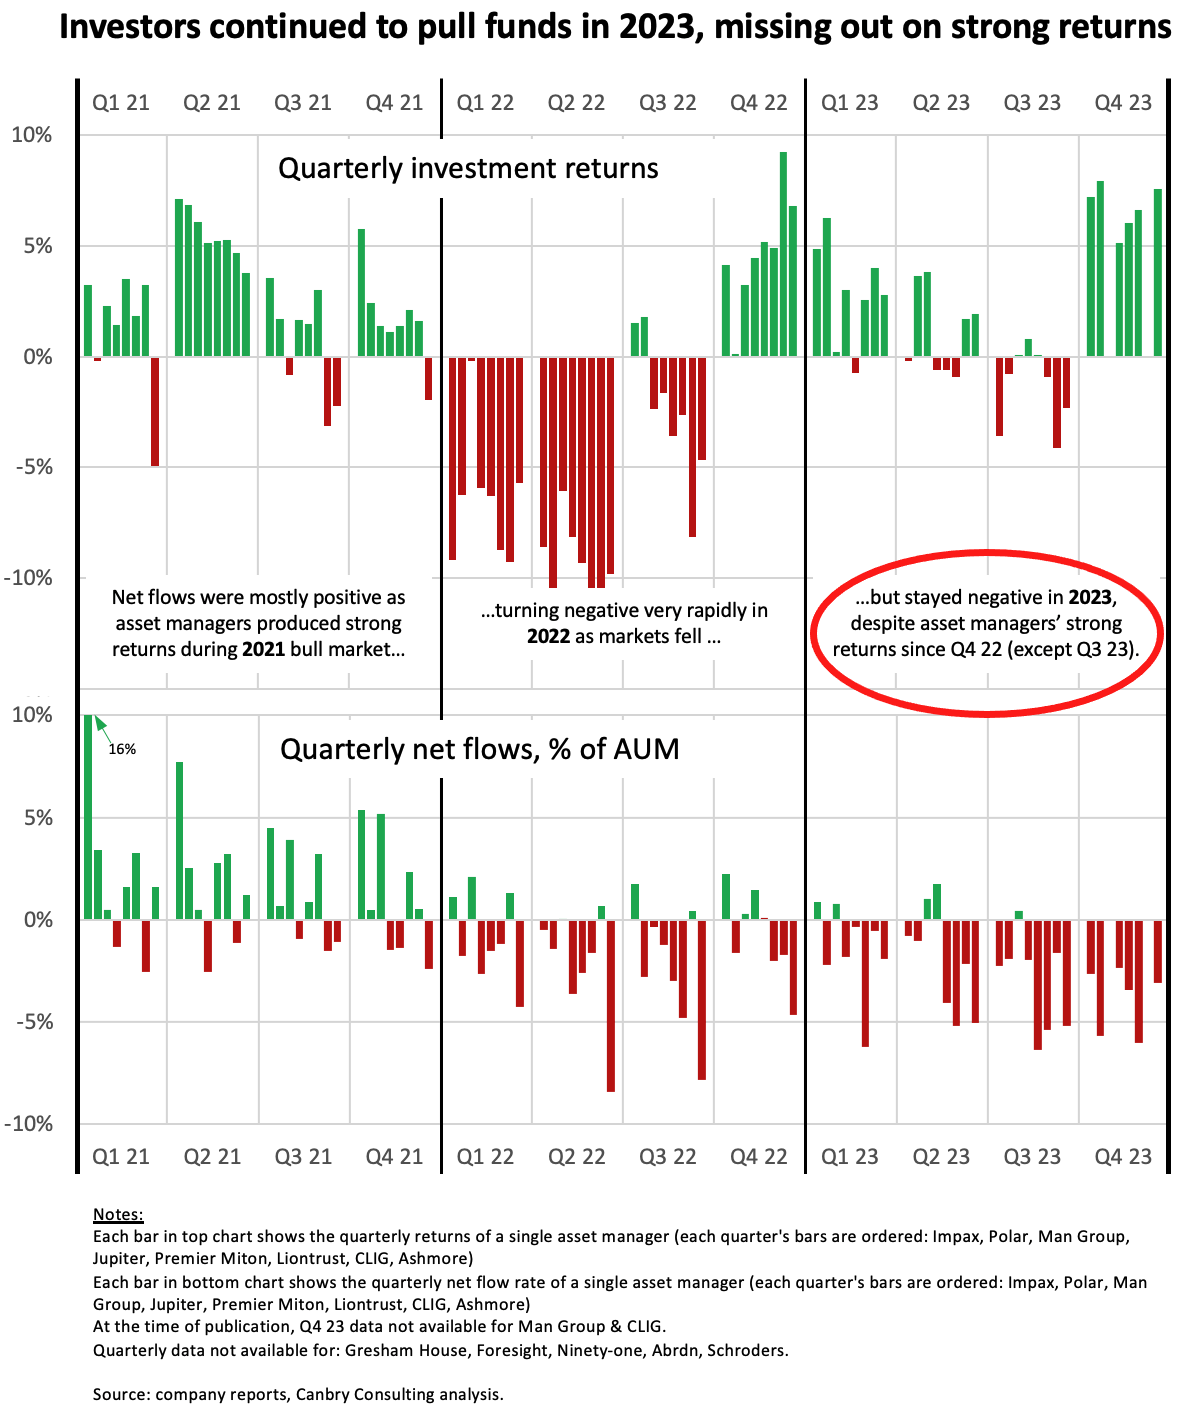
History suggests this mismatch doesn’t last for that long. In recent months, I have used the chart below in a few of my