When I wrote about Price-to-Sales, I called it the King of Value Factors quoting Jim O'Shaughnessy, who found that this was the best-performing Value factor for US stocks from 1951-2003. What was notable was how badly the decile with the highest Price-to-Sales did. This generated just a 3% compound return, less than inflation for the period:
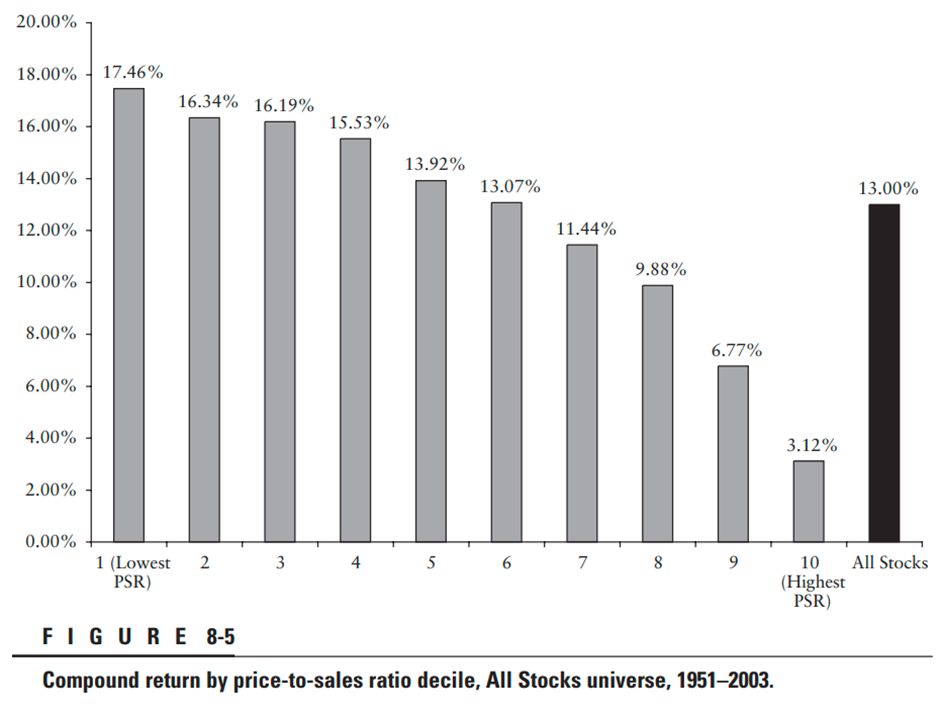
One thing is clear from this long-term study: investors really don't want to be in the highest Price-to-Sales stocks. However, 2003 is a long time ago and reflects a general market nadir, which may have undue influence on the results. When Gray and Carlisle did their pretty exhaustive study into which value factor performed the best, using 1971-2011 data, Price to Sales didn't even make the running.
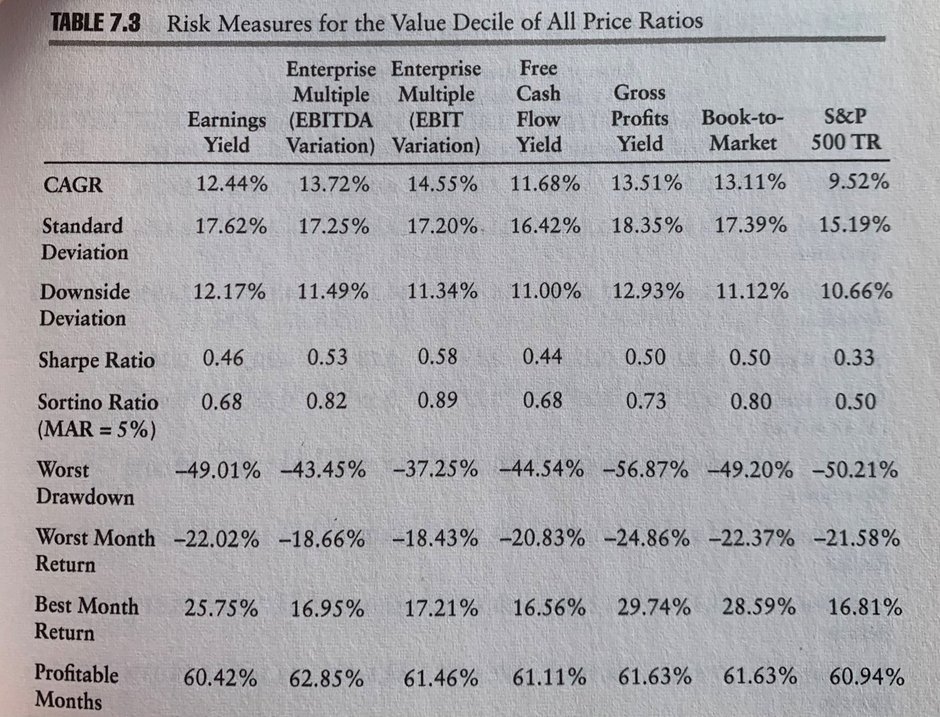
Reader @iwright7 pointed out in the comments that there have been some more recent studies than this. For example, in 2014, Jim O'Shaughnessy’s son Patrick suggested screening for EV/FCF <10 as a good Value metric. He also quoted the following research called An Update on the Valuation Metric Horserace: 2011-2015, also by Wes Gray, with Jack Vogel, which concluded:
B/M REALLY stunk.
Enterprise multiples stunk (although variations such as EBIT/TEV were a bit better).
E/M (which represents P/E) were lame.
Gross profits / TEV results were pretty solid.
FCF/EV was great!
So we now have data as recent as 2015, which suggests we should be looking at EV/FCF. And I agree FCF is an excellent value metric. At the end of the day, a business is worth the net present value of the cash it returns to shareholders over its life. Producing large amounts of cash flow now, which could be returned to shareholders if appropriate, is a good sign.
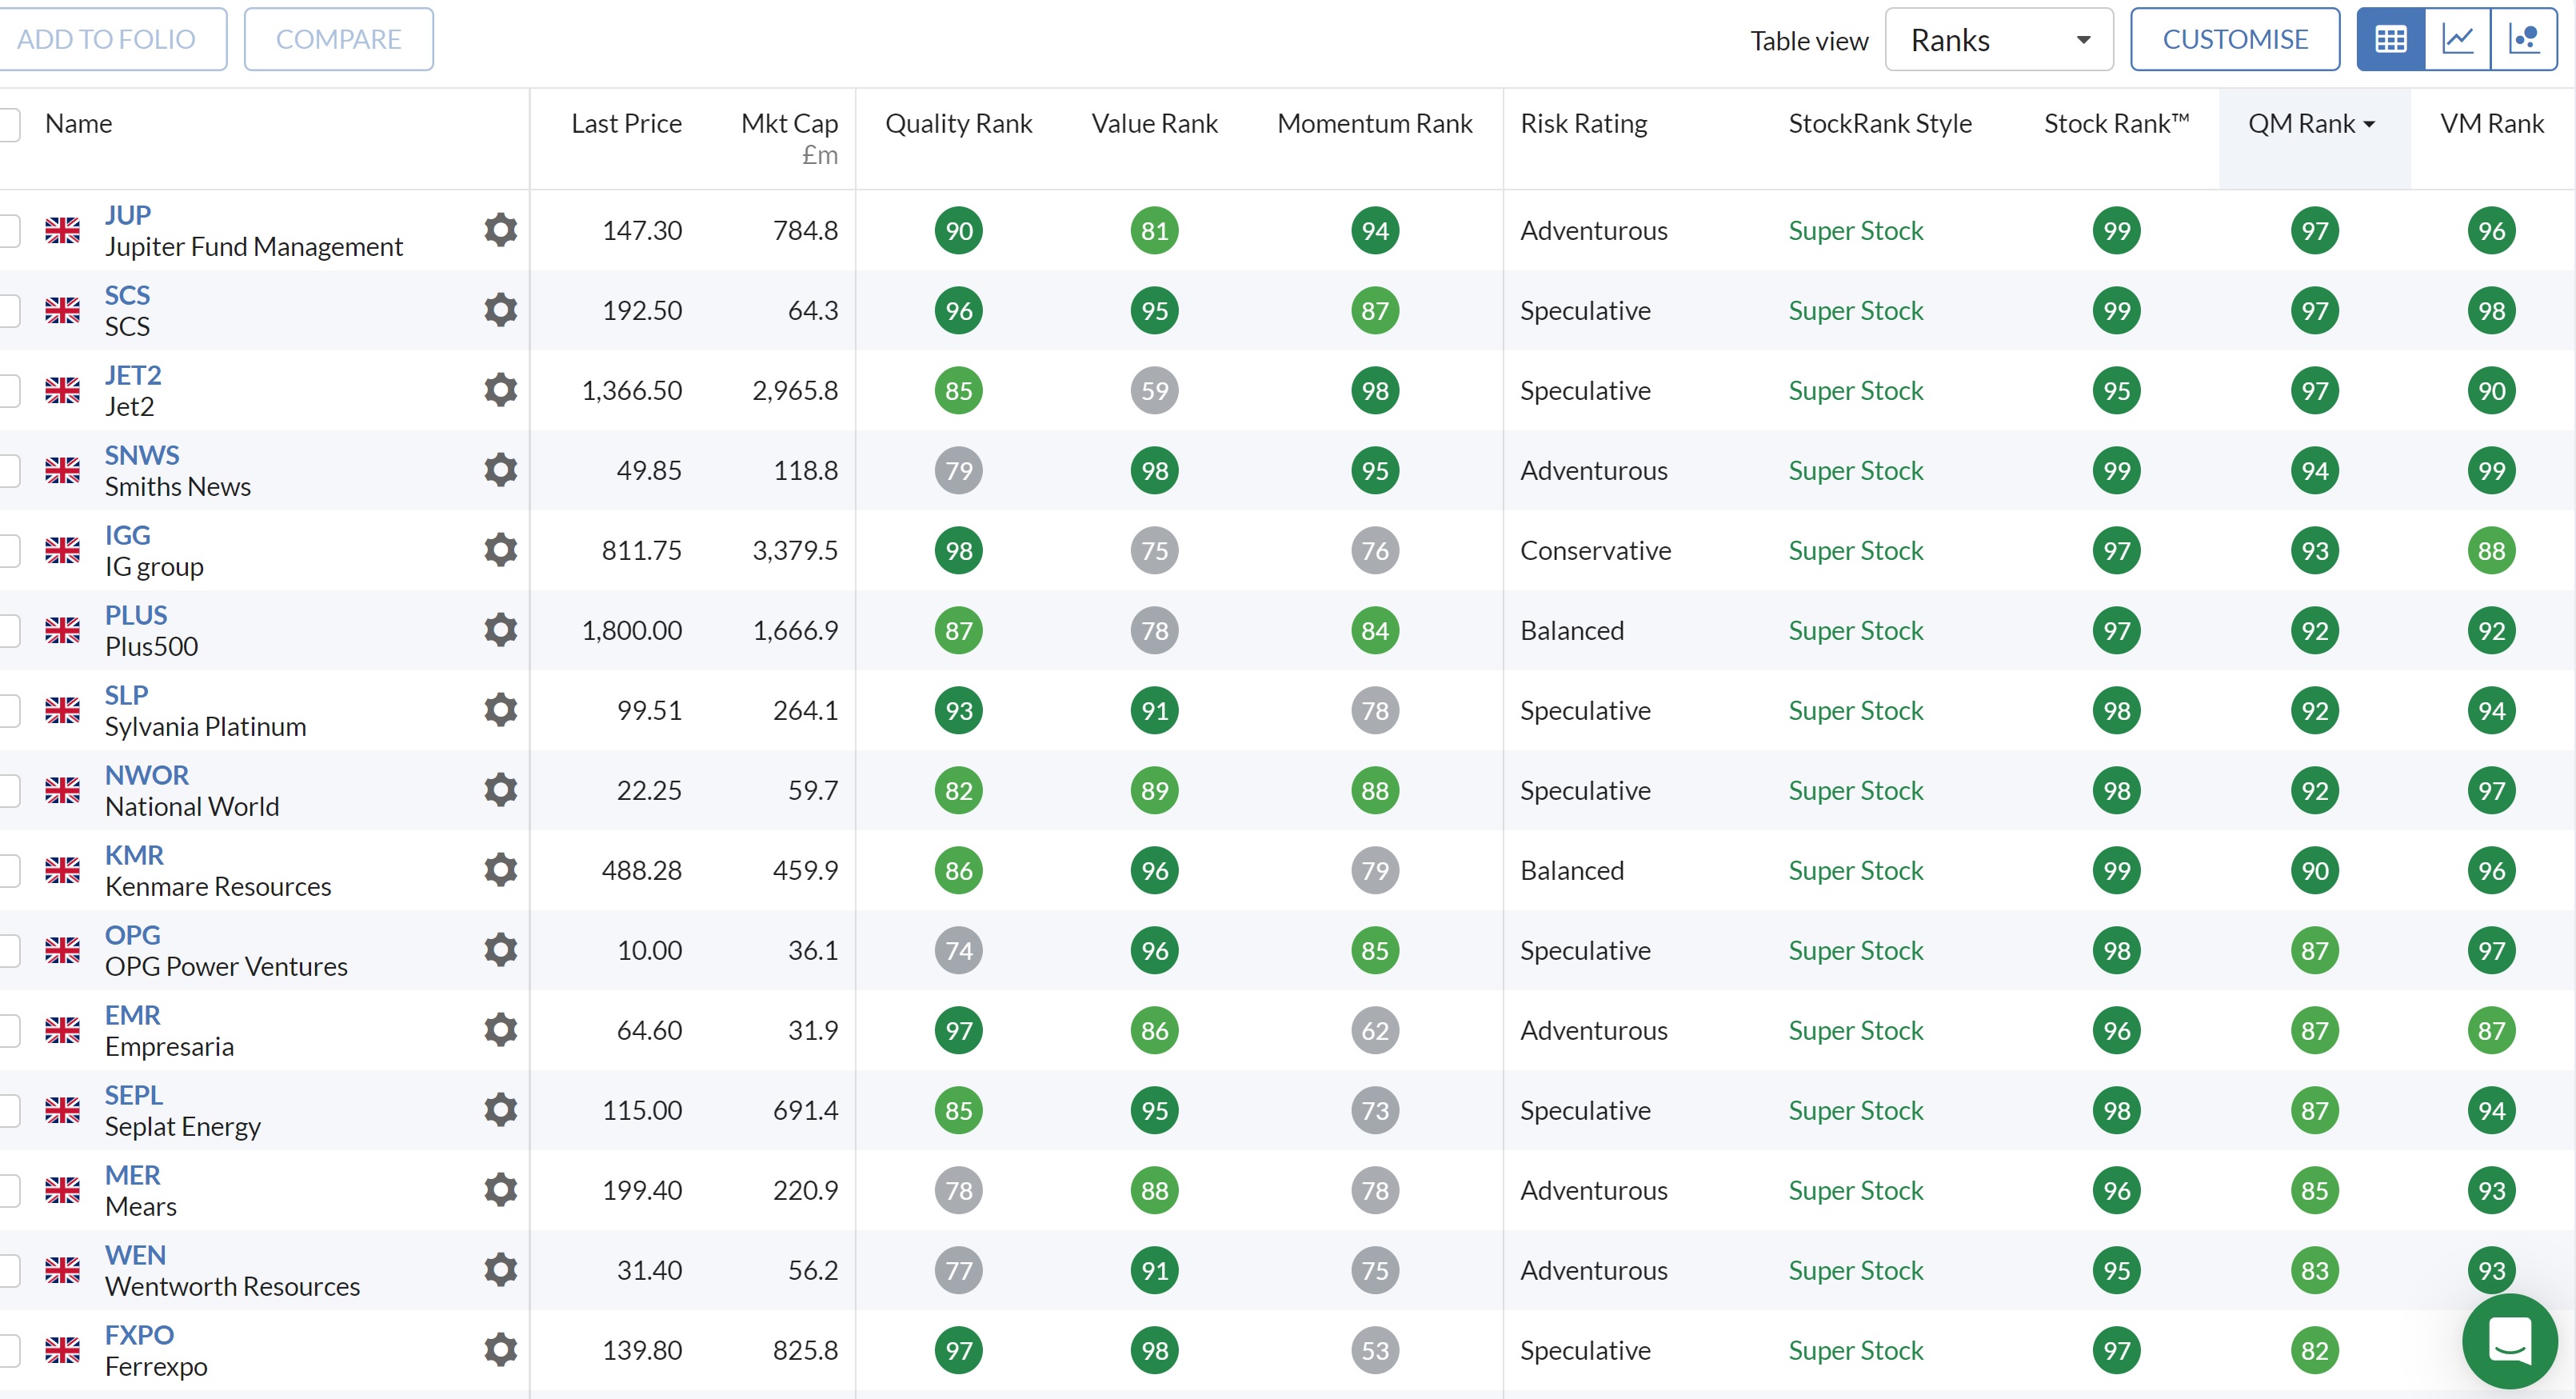
It is tempting to think that we could build a very simple screen taking the lowest decile on EV/FCF (we want companies with the highest FCF), exclude the very smallest companies and invest in the whole set to generate market-beating returns. Something like this:

However, we must be careful about throwing away all the other Value metrics. The results that Gray & Vogel are referring to are for the five years from 2011-2015. When they look at the full sample from…