This is the final piece in my mini series of checklists highlighting the characteristics I look for in different types of shares. I’ve previously published pieces looking at quality stocks and growth stocks.
In this piece I’ve focused on the approach I’d use to find reliable dividend shares.
Checklist for reliable income
If I’m screening for new dividend stocks, I will probably restrict my search to companies with a market cap of at least £100m.
There are a few good, small companies that pay dividends, but in general I find most suitable opportunities are above £100m market cap. I don’t use an upper limit, as the FTSE 100 and FTSE 250 are home to many reliable income stocks.
Dividend history
Past performance is not a guide to future returns. But in general, I have found that companies with a long history of shareholder payouts are likely to have an established dividend culture and will try to maintain this record.
The pandemic led to a one-off break in many companies’ dividend histories. I tend to ignore this, if payouts have resumed at more or less constant levels following a brief pause. This does make screening for long dividend streaks more difficult, though.
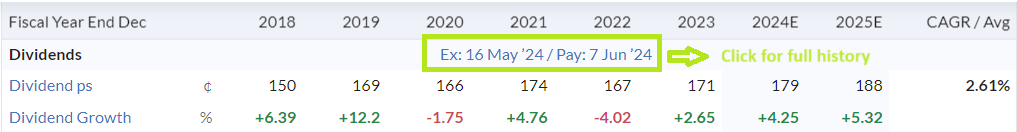
A visual check of the StockReport helps to tell the story – remember you can click on the last-paid date for a full dividend history:
For screening, there are a range of useful metrics we can use:
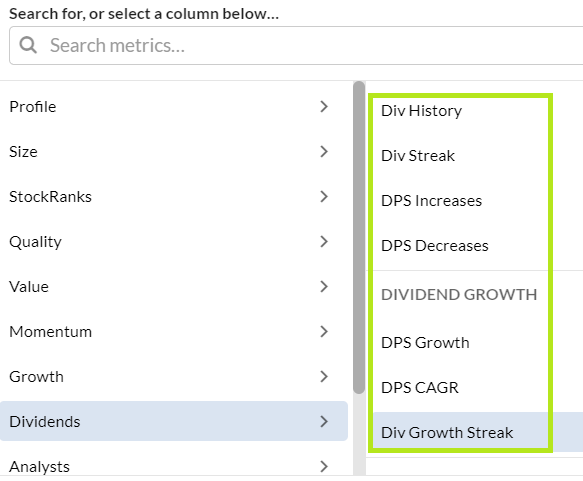
A full explanation of each measure is provided in the right-hand panel of the screener dialogue. But in short they allow us to score a company’s dividend history against various standards.
Least demanding is Dividend History. This is a binary measure that simply indicates whether a company has paid a dividend in the last five years.
At the other end of the scale is Div Growth Streak which counts how many years of consecutive dividend growth a company has achieved in the last 10 years.
I tend to take a middle route at this early stage and use Div Streak to count how many consecutive years a company has paid dividends, regardless of any cuts.
Dividend cover
The standard measure of dividend affordability is to compare…