Company Valuation: A checklist

The value is always in the eye of the beholder. What is worthless to one person may be very important to someone else. ― Peter Ackroyd
There are two methodologies when valuing a business, absolute and relative valuation.
Absolute valuation involves seeking to determine a company's intrinsic or "true" value based on its cash flows, expected growth potential and risks. Relative valuation involves comparing a company's valuation to that of other similar companies, using financial ratios to determine if it is over or under-valued.
If one was to think like an entrepreneur who was evaluating a purchase of a whole business, they would be buying both the company’s existing assets, but also the future earnings of that company. In a similar vein, the top two things that equity investors hunting for value try to do is to buy assets on the cheap or earnings on the cheap. While not many investors managed to make it to accountancy school, there are a few shortcuts available to understand a company’s valuation and its business quality.
While some financiers specialise in evaluating these things in extremely complicated ways, plenty of investors have had great success just focusing on the simplest ratios like the Price to Earnings (P/E) Ratio and Price to Book (P/B) Ratio. The following six ratios are essential weapons to keep sharpened in the armoury.
Price to Earnings Ratio (P/E) – buy earnings on the cheap
Due to its simplicity and intuitive output, the P/E ratio is perhaps the most popular valuation ratio in investing.
By dividing a company’s stock price by its earnings per share, investors get an instant fix on how highly the market rates it. It is effectively shorthand for how expensive or cheap a share is compared with its profits. Thinking like an entrepreneur buying an entire business, one can think of the P/E as the number of years of profits it would take to get cover the price paid for the business.
The ultimate value investor’s version of the P/E is known as the CAPE or cyclically adjusted P/E ratio. It takes the current price and divides it by the average earnings per share over the last 10 years. Sometimes current earnings can be overly inflated due to a business boom so the CAPE gives a much more measured view. Originated by Ben Graham and popular in the blogosphere it’s an excellent part of the value investors toolkit.
The trouble though with the P/E ratio in general is that it doesn’t take a company’s debt into account and, in a value investing situation, that’s a pretty serious shortcoming which makes comparing differently leveraged companies like-for-like almost impossible. This is where the so called earnings yield comes in…
The Earnings Yield (or EBIT / EV) – buy earnings on the cheap
Investors have a tendency to switch off when faced with tricky jargon. So if you’ve made it to this sentence you are doing pretty well. Most investors define the Earnings Yield to be the inverse of the P/E ratio (or E/P) and consider it a great improvement. Why? Because yields can be compared with other investments more easily – for example bonds and savings accounts – whereas P/E ratios are, well, sort of useless for comparing against well, anything… other than other P/E ratios of course. This is most probably why brokers and the media love PE Ratios so much as they are infinitely flexible for ramping stocks up to silly valuations.
But, given that the P/E (and thus E/P) ignores debt – Joel Greenblatt in the Little Book that Beats the Market redefined it to take the debt into account. His definition compares the earnings due to all stakeholders in the firm (the operating profit) to the entire value of capital invested in the firm (i.e. the debt + the equity or ‘enterprise value’).
Just be aware that the earnings yield defined this way is a far better version of the P/E ratio for comparing how cheap differently leveraged stocks are to other stocks and that it’s definitely the right way up for comparing stocks with bonds (which is what a lot of Value Investors like to do).
Price to Cashflow - a good catch all?
The price to free cash flow ratio compares a company’s current share price to its per-share free cashflow. Free cashflow is defined as cash that the operation creates minus any capital expenditure to keep it running. It’s the amount of cash left over which a company can use to pay down debt, distribute as dividends, or reinvest to grow the business.
The benefits of looking at the price to cashflow versus other ratios like P/E or P/B Ratios are several - firstly some companies systematically understate their assets or earnings which can make them harder to isolate with a low P/E or low P/B scan – but secondly earnings and assets can be manipulated by crafty management accountants to make companies appear more profitable or asset rich than they actually are. In Josef Lakonishok’s studies he showed that the return profile of using the P/CF ratio is very similar to the P/B and P/E ratio - cheap P/CF stocks massively outperform high P/CF stocks in almost all timeframes - making it imperative to hunt for low P/CF stocks.
Price to Book Value - buy assets on the cheap
The P/B ratio works by comparing the current market price of the company to the book value of the company in its balance sheet. Book Value (also known as Shareholder Equity) is what is left over when everything a company owes (i.e. liabilities like loans, accounts payable, mortgages, etc) is taken away from everything it owns (i.e. assets like cash, accounts receivable, inventory, fixed assets).
It is worth noting that this book value often includes intangible assets that represent the non-physical value of a company (such as goodwill and intellectual property) which are born from accounting rules and aren’t really ‘tangible’ like plant, property and equipment. Some investors there remove such ‘intangible’ assets from calculations of P/B to make the more conservative Price to Tangible Book Value (P/TB).
The P/B ratio has an esteemed history. As it doesn’t rely on volatile measures like profits and has a hard accounting foundation in the company’s books, it has often been used as the key barometer of value by academics.
Most Value Investors try to buy stocks at a discount to their Book Value – or when the P/B ratio is at least less than 1.
Price to Sales Ratio – No earnings? Buy sales on the cheap
But what do you turn to when a stock doesn’t have any earnings and therefore no PE ratio? While earnings can vary from year to year, sales are much more stable and as a result one of the more popular approaches is to look at a stock’s Price to Sales Ratio.
The ratio was first popularised in the 1980s by Kenneth Fisher in the book Super Stocks and later labelled the ‘King of the Value Ratios’ by another author Jim O’Shaughnessy in What Works on Wall Street. But it really got a bad name when it was misused in the dotcom bubble to justify nosebleed valuations.
But it does remain a key indicator for isolating potential turnaround stocks. Low Price to Sales Ratio stocks, especially compared against their sector, can often be stocks that bounce back very quickly as they return to profitability. Look out for Stocks with historically reasonable margins trading on P/S ratios of less than 0.75 without much debt.
PEG Ratio – Buy earnings growth on the cheap
Popularised by ex-Fidelity star fund manager Peter Lynch and later given a twist by UK investment guru Jim Slater, the price-to- earnings growth ratio, or the PEG, takes the PE Ratio and puts it on steroids. The trouble with the PE Ratio is it is so variable depending on the growth rate of the company. By dividing the PE Ratio by the forecast EPS growth rate an investor can compare the relative valuation of each more comfortably.
It is generally accepted that a PEG ratio of under 1 signifies growth at a reasonable price (e.g. PE ratio 20 for EPS growth of 20%) - though be aware that when market valuations fall below average this barometer should be reduced. While the PEG tends to focus on the growth prospects of a stock, which aren’t necessarily vital to a value hunter, it nevertheless gives improved depth to the more simplistic PE for investors that like a bit more bang for their buck.
Beating them all with a composite value ratio
Rather than having to analyse stocks against multiple different metrics, there is also another way.
In "What Works on Wall Street", James O’Shaugnessy illustrated how to build a composite value factor based on an average ranking of 6 ratios - P/S, P/E, P/B, P/CF, EBITDA/EV, and Shareholder Yield (dividends+buybacks).
Each company in the market was ranked from 1 to 100 for each of these value ratios and the composite is calculated as the average of all. Given the above background about how different ratios perform better in different eras, it's perhaps unsurprising that if you buy the cheapest stocks in the market based on this composite measure you get better overall returns with less risk than using the ratios individually.
For example between 1964 and 2009 - using Price/Sales alone - the best 10% of stocks by Price to Sales rebalanced annually returned 14.5% with a standard deviation (volatility) of 20.7%. But by using the composite value factor instead the return was improved to 17.3% and the standard deviation reduced to 17.1%. O'Shaugnessy implied that these returns could be even further improved by filtering the universe further for higher quality stock.
Introducing the ValueRank
Building on O’Shaugnessy’s finding, the Stockopedia ValueRank is a composite of 6 individual metrics, to help paint an overall picture of the company’s valuation.
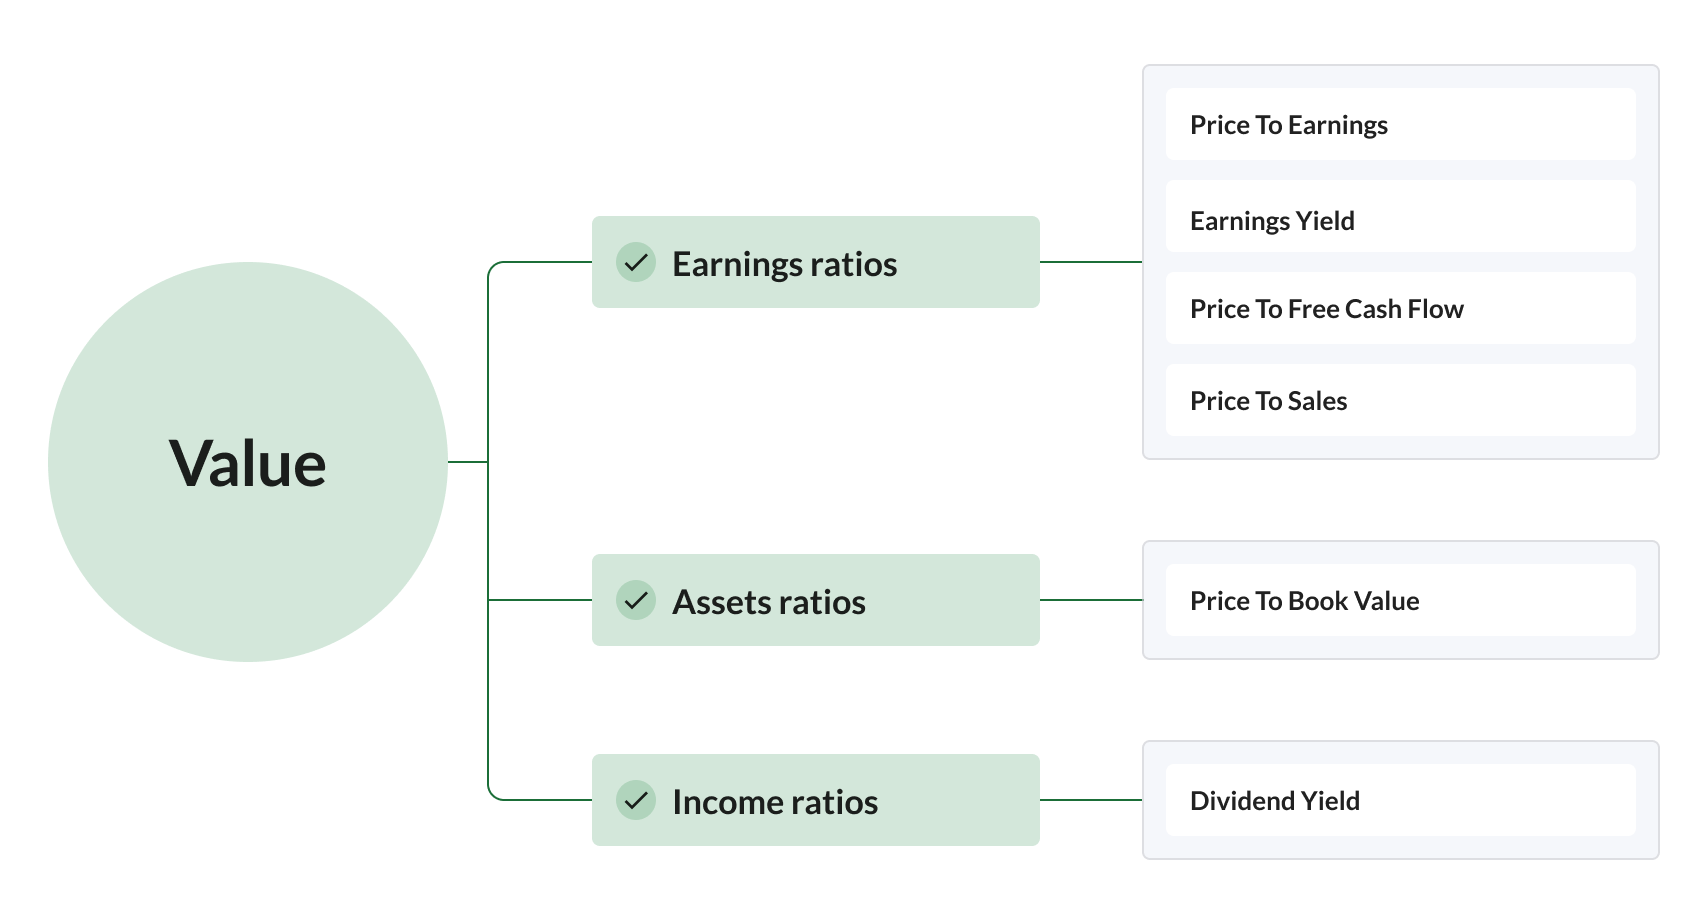
Each company in the market is ranked from 1 to 100 for each of these value ratios and a composite score is calculated as the weighted average of all valid values. The ValueRank™ is then calculated between zero and 100 for this composite score, where 100 is best and zero is worst. Consistent with the value investing philosophy, we use historic ratios for each of these metrics, rather than factoring in analyst forecasts.