The top 20 clearest trending US stocks - with dominant returns over UK small and mid caps

This week I had an email from a long-term subscriber whose SIPP has grown by 82% year to date. He’s very much a “quality and momentum” investor, who expanded his horizons to North American markets a number of years ago when he felt the growth prospects were poor for UK stocks. It’s been tremendously successful for him, with his biggest SIPP winner year to date being Celestica (NYQ:CLS) - a Canadian provider of Cloud Infrastructure for Google and Facebook - returning 743%. “I would never have found those companies without Stockopedia”.
I have to admit I have as much home bias as anyone, and haven’t participated enough in the US market gains. Knowing the UK markets well, and how to craft returns from them has worked, and I am cautious with the high valuations inherent in US stocks. Nonetheless, I do keep kicking myself when I hear of growth company stories like this. What our companies struggle to achieve in a decade, it seems like American companies can achieve in a year.
So I thought I’d finish up this triptych of articles on Trended Momentum with a look at the USA.
How have the May list of 20 US stocks performed?
Back in the “Didn’t buy Warpaint?” article published on May 30th, a few asked me to run the same process that I’d run on UK stocks, on the USA. The list was shared in the original comments. Since that date, the S&P 500 has appreciated 15%, but the US Trended Momentum list has significantly outperformed with a 23% gain - and this was a list that included General Motors not Tesla!
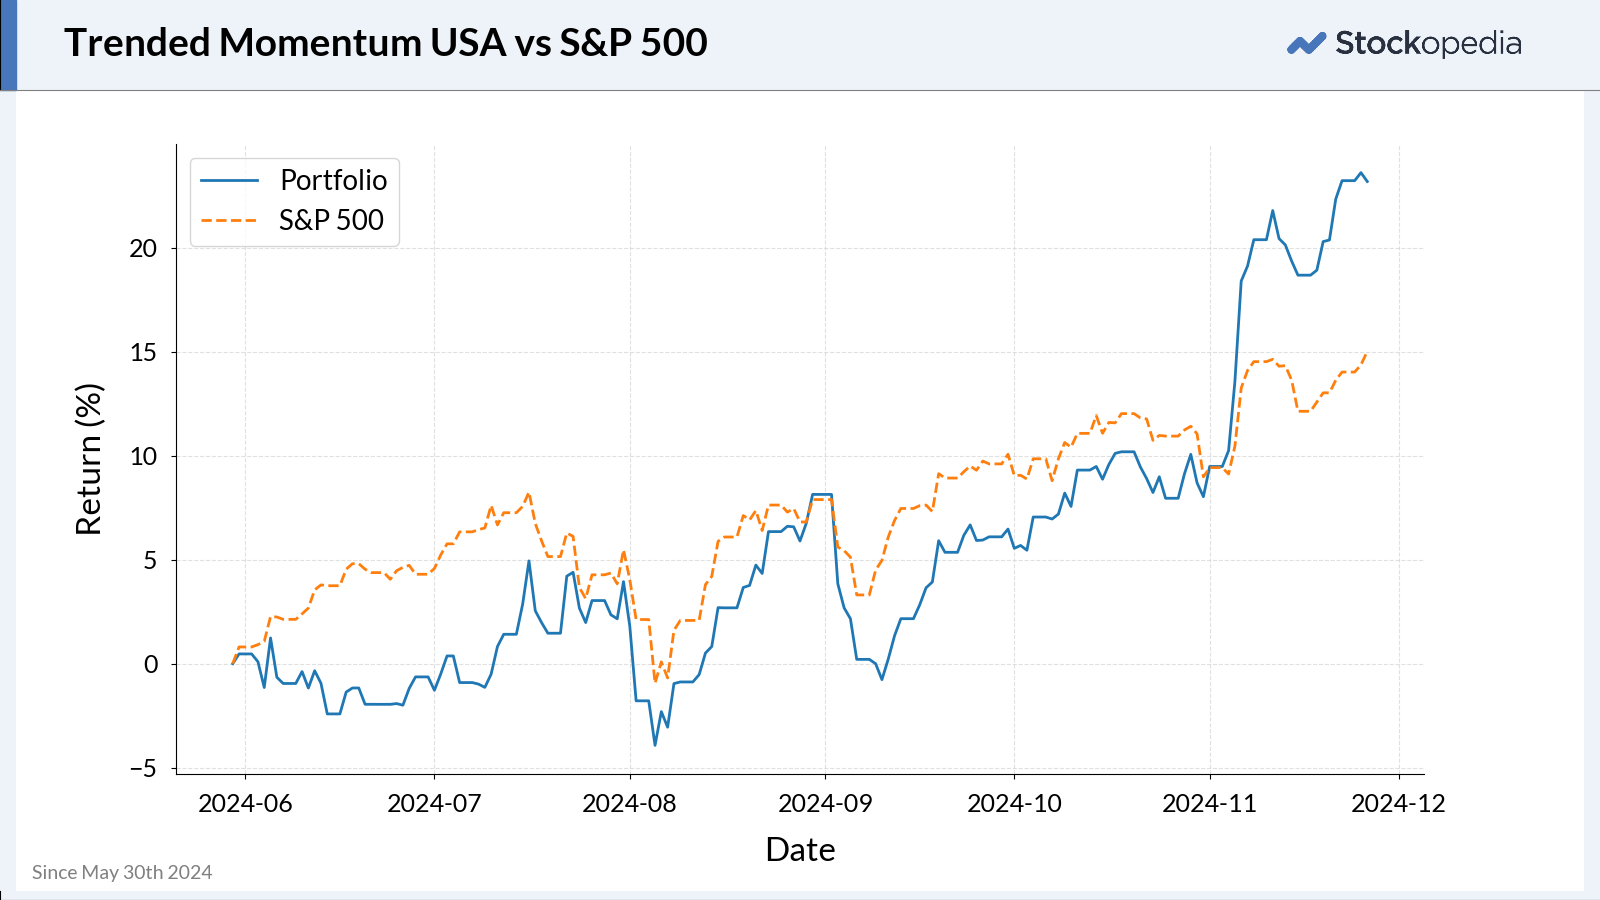
Since that date, there have only been 3 losers in the list, with 17 winners. The biggest winner +93% has been the $12bn Sprout’s Farmers Market, which appears to have been a classic Peter Lynch style multibagger, followed by the airline SkyWest +60% and Interactive Brokers +51%. It’s not all been about Artificial Intelligence and Cloud Computing in US markets.
This is past performance over an extremely limited timeframe of course, and the near future may not see such strong results - but who knows. Momentum breeds momentum, and the broad Russell 2000 Index has just broken out to a new all-time high.
Reviewing the history
I’ve backtested a similar process to the one run for UK small and midcaps published over the last fortnight. 80+ StockRank, top 20% winners, highest trend clarity, minimum £50m market cap. It should be noted that any backtesting process can be prone to biases and subject to the usual risk caveats - but nonetheless, here are the results.
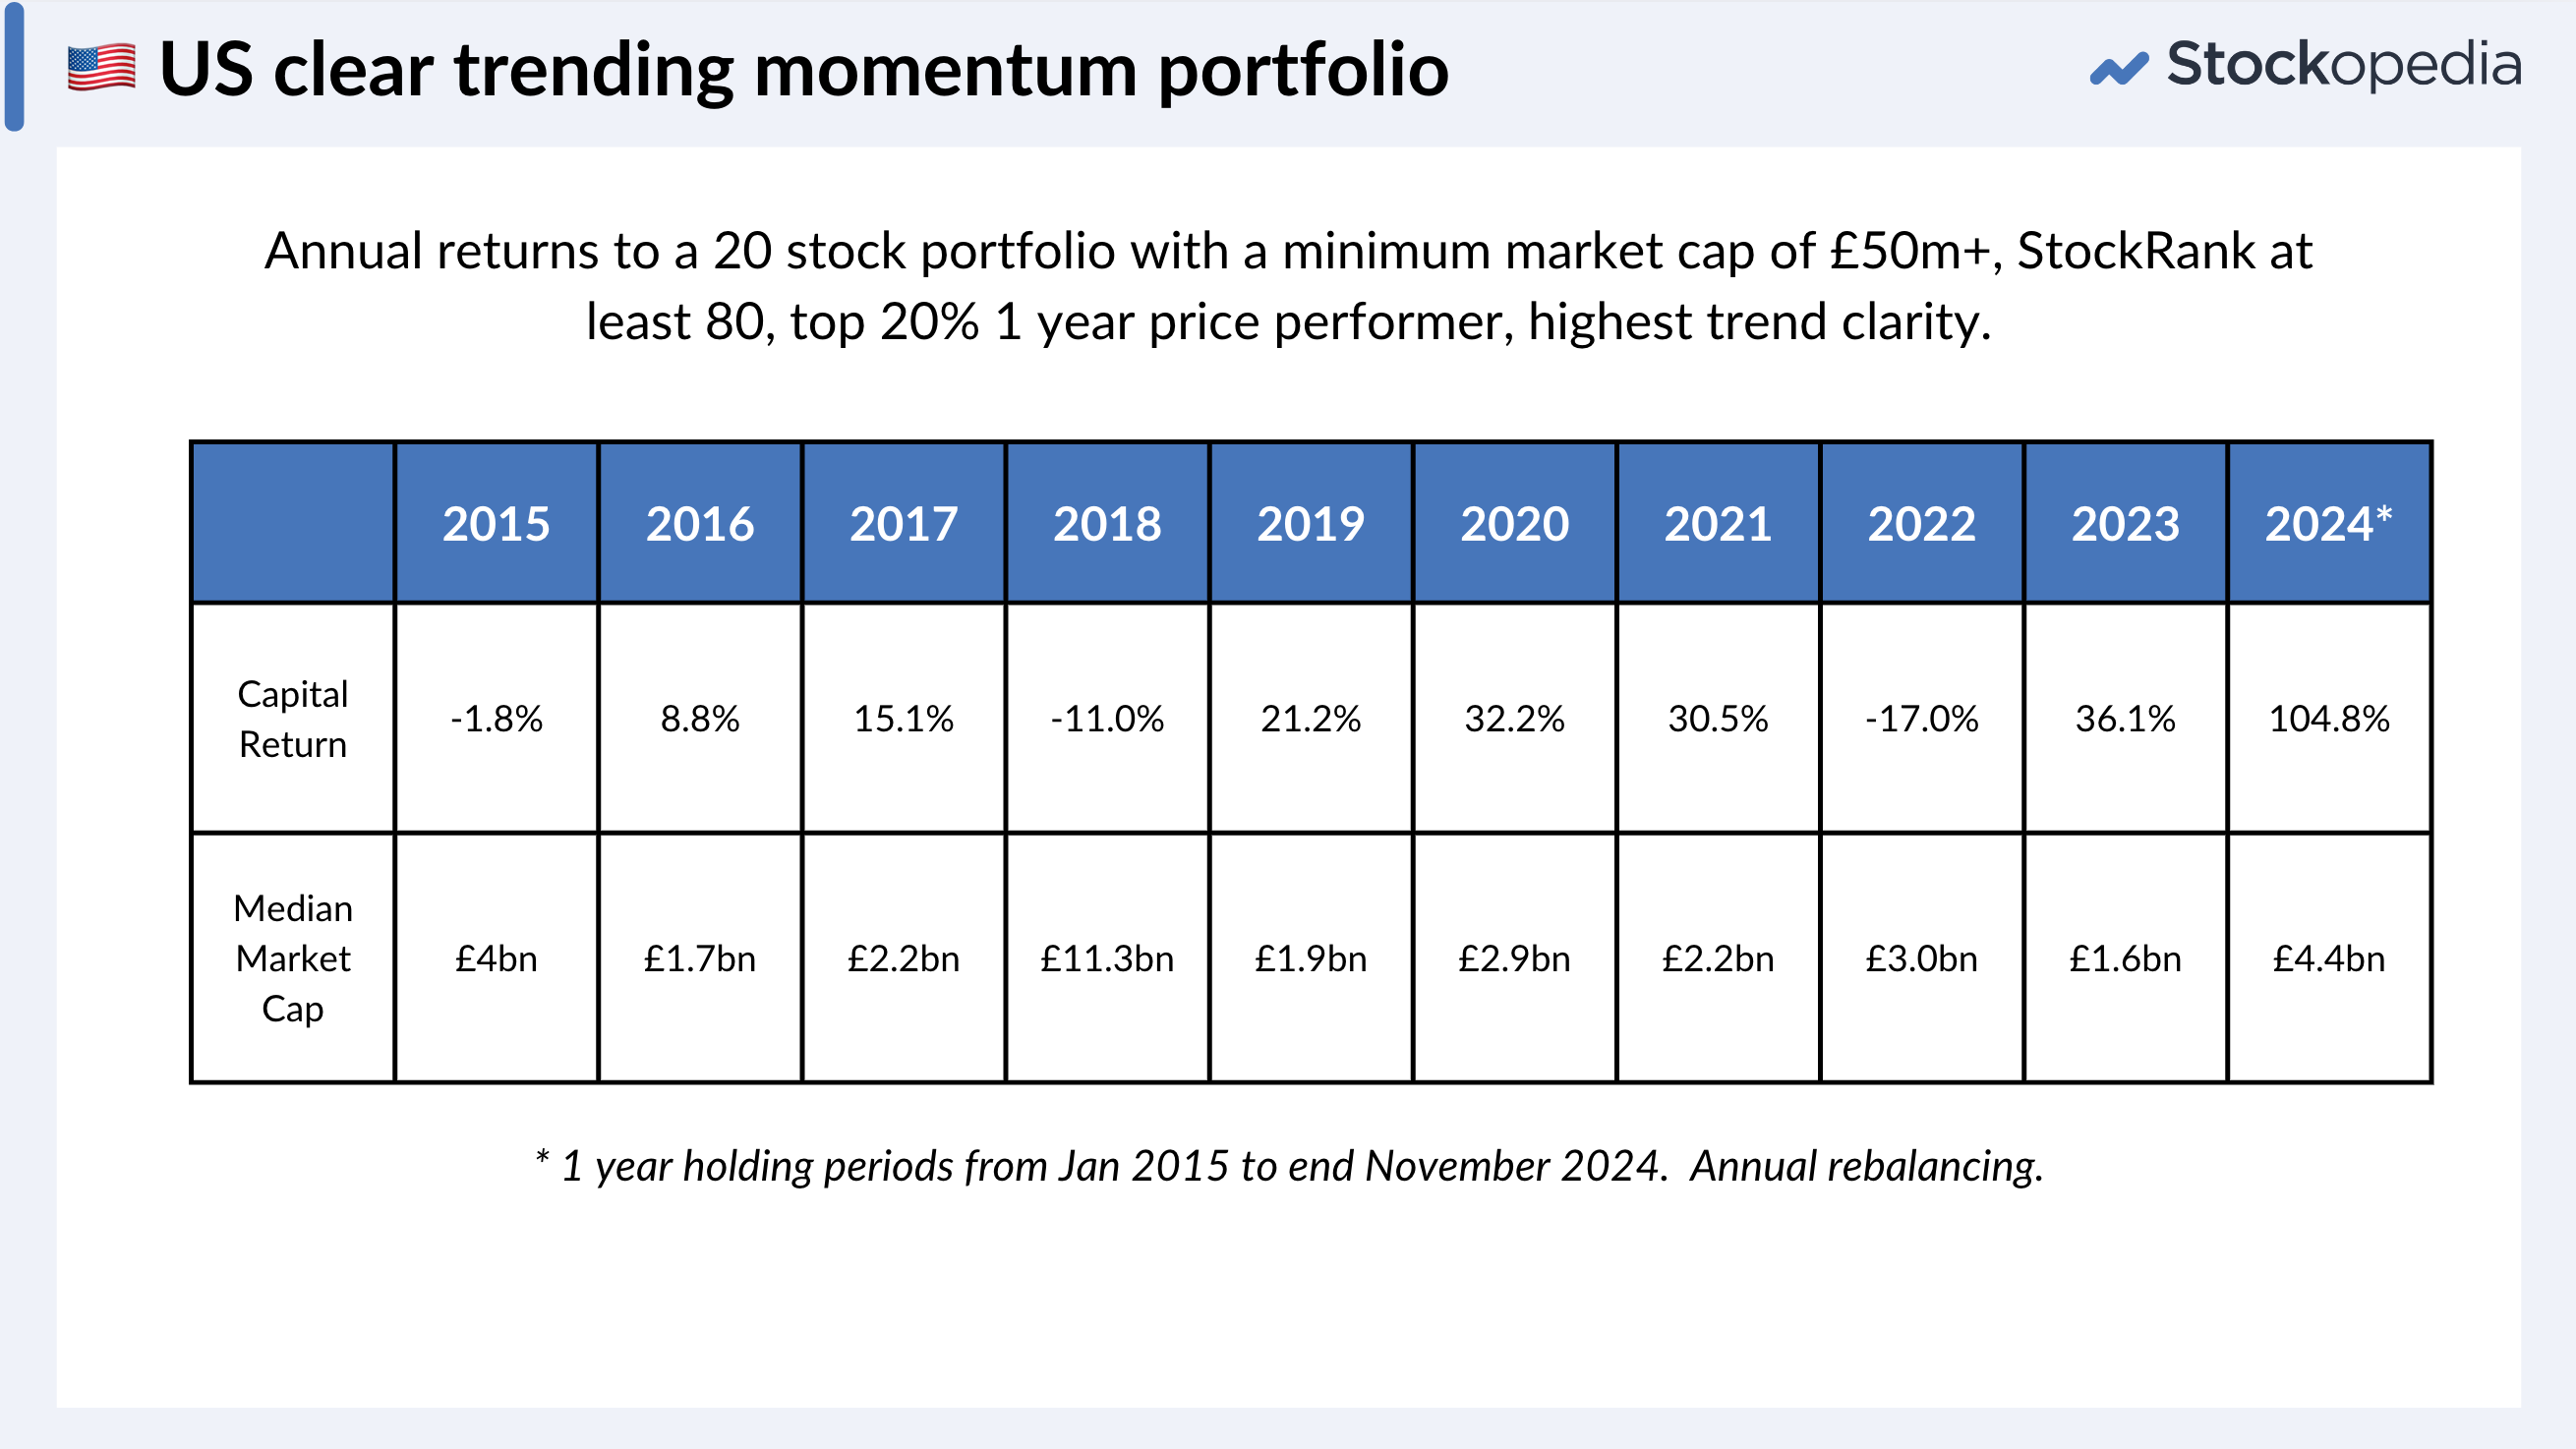
That’s an 18.3% annualised return, over just under 10 years, compared to 11.1% for the S&P 500. The first four years only returned 9% annualised, while the most recent 6 have returned more than 30% annualised. The returns since January have been 105% across the 20 stocks. When the process picks stocks like Applovin - which has more than eight bagged year to date - you can understand why. Quite incredible.
The median market capitalisation of stocks owned in the portfolios through this decade was £3.5bn - that’s a “Large Cap” from a UK perspective. These are FTSE 100+ sized businesses compounding at 18% annualised. These have crushed the returns of the similar process for small and mid-cap UK stocks. It’s very humbling.
So what qualifies today?
In the interests of consistency I will publish the top 20 US candidates as of today.
| Name | Mkt Cap (m GBP) | Stock Rank™ | Sector |
|---|---|---|---|
| ACI Worldwide (NSQ:ACIW) | 4782 | 96 | Financials |
| Brightview Holdings (NYQ:BV) | 1294 | 93 | Industrials |
| Carpenter Technology (NYQ:CRS) | 7779 | 83 | Basic Materials |
| Curtiss-Wright (NYQ:CW) | 11324 | 82 | Industrials |
| Godaddy (NYQ:GDDY) | 22311 | 80 | Technology |
| Howmet Aerospace (NYQ:HWM) | 37878 | 81 | Industrials |
| Jackson Financial (NYQ:JXN) | 6020 | 87 | Financials |
| Lemaitre Vascular (NMQ:LMAT) | 1886 | 80 | Healthcare |
| Mueller Water Products (NYQ:MWA) | 3140 | 91 | Industrials |
| Phibro Animal Health (NMQ:PAHC) | 765 | 86 | Healthcare |
| Pilgrims Pride (NSQ:PPC) | 9571 | 99 | Consumer Defensives |
| Piper Sandler Companies (NYQ:PIPR) | 4853 | 86 | Financials |
| Sprouts Farmers Market (NSQ:SFM) | 12197 | 91 | Consumer Defensives |
| SPX Technologies (NYQ:SPXC) | 6602 | 87 | Industrials |
| Sylvamo (NYQ:SLVM) | 3082 | 98 | Basic Materials |
| Tenet Healthcare (NYQ:THC) | 11020 | 99 | Healthcare |
| Trane Technologies (NYQ:TT) | 75045 | 85 | Industrials |
| Tutor Perini (NYQ:TPC) | 1183 | 84 | Industrials |
| Universal Stainless & Alloy Products (NSQ:USAP) | 329 | 96 | Basic Materials |
| Willdan (NMQ:WLDN) | 485 | 97 | Industrials |
Now I’m no expert in US stocks, but there’s a striking absence of AI, semiconductors, digital infrastructure and SaaS. The StockRank 80 cut off tends to keep those kinds of over-popular, highly valued sectors out of the list. The US market is huge and while the narrative feeding frenzy heads in one direction, there’s a depth of great businesses.
Some of the investment themes that fall out of the list:
- Sustainable building solutions - Trane Technologies, SPX Technologies, and Mueller Water Products - these companies may be reflecting a shift in industrial markets towards more sustainable solutions across ventilation, water and climate solutions.
- Healthcare services - Tenet Healthcare, Lemaitre Vascular, and Phibro Animal Health - while so many focus on biotechnology stocks seeking moonshots, there’s a middle ground of businesses that focus on the infrastructure and services that keep healthcare systems running, and they are riding steady demographic trends.
- Specialist engineering - Howmet Aerospace, Carpenter Technology, and Universal Stainless & Alloy Products - these businesses provide specialist engineering services to the aerospace, defence and industry. High margin, moat businesses.
I’d be fascinated to know if you are investing in the USA, how you’ve been doing, and whether your results have been as outstanding as the subscriber mentioned in the opening?
Disclaimer
This is not financial advice. Our content is intended to be used and must be used for information and education purposes only. Please read our disclaimer and terms and conditions to understand our obligations.

125 comments
Celestica (TSE:CLS) just dropped another earnings surprise beating EPS expectations by 13% and raising yearly EPS estimates by a conservative 10%. This is the 9th consecutive quarter where they have beat analysts EPS estimates.
Perhaps if AI/tech explosion is akin to the Gold Rush then investing in Celestica (TSE:CLS) is equivalent to investing in shovel providers rather than investing in gold miners?
Amphenol (NYQ:APH) is another stock I hold that appears to be taking advantage of the AI/tech infrastructure surge with reportimg ...
"Massive investments by technology and defense firms in new technologies like artificial intelligence, which require significant computing infrastructure, have boosted demand for Amphenol's equipment."
Amphenol Corporation is a designer, manufacturer, and marketer of electrical, electronic and fiber optic connectors and interconnect systems, antennas, sensors and sensor-based products and coaxial and high-speed specialty cables.
So thinking more on this ... This is why I dislike only buying stocks from one market like the UK. For those that don't know (have you had your head under a rock?) there is a massive race going on to win the AI battle and this is happening not just at corporate level but at government level. The US will want a superior AI to China and vice versa.
If you're not interested in trying to pick the commercial winner of that race (Amazon, Google, Microsoft, Palantir, etc.) then perhaps as I've suggested a shrewder strategy would be to invest in firms that provide the infrastructure to the competitors slugging it out.
So if you're fishing purely in the UK market who are you going to invest in to take advantage of that? In my opinion, that's why you need to be in the US markets.
Well spotted. Celestica (NYQ:CLS) are up 17.5% so far.
Yup it's a bumper day for me today
#metoo
Universal Stainless & Alloy Products (NSQ:USAP^A25) has delisted now.
This folio of 20 stocks has recovered now only -5%, was down 12% a while ago. 5 stocks are in profit.
I did pick a different stock, which looked good to me MasTec (NYQ:MTZ) this may benefit from Trump being in power.
Weave Communications (NYQ:WEAV) has a clear trend at the moment with plenty of volume. I haven't access to USA stocko at the moment to see if it has a decent rating
The rating is not that good.
Robinhood Markets (NSQ:HOOD): a stock with a smooth trend, making a 52-week high today on good volume.
I've recently owned 8 stocks off of this list. The only one I still have is gddy. All of the other ones I had exhibited a significant technical breakout but were later followed by enough of a downturn that I didn't want to hold them. The breakout most probably caused their momentum score to spike, but IMO that's probably temporary.
A couple of nice developing trends Metro Bank Holdings (LON:MTRO) and FD Technologies (LON:FDP) Notice the Stockrank turning bullish
Sprouts Farmers Market (NSQ:SFM) trend coming to an end, if you follow the O'Neill disciples, after it violated the 50MA. It's been above it since December last year. Awesome performance
Most on this folio are similar, it is down over 10%. Top momentum stocks have been hit hard.
Ed Croft,
Would really appreciate it if S/O increased its routine /daily/weekly focus on US Stocks.
Can you rerun this "20 Clearest trending US stocks again in early January
I have all these 20 stocks that Ed selected, set up on a folio, every single one was down today.
Overall only 2 are in profit. 4 are down over 10%.
The folio is now 7% below the S&P500 index.
I got onto ALAB, thanks to this thread/approach. There are some impressive forecast metrics in its StockReport.
Hello what is R^2 ? Regression Analysis?
The correlation between 2 data sets. Ranges between 1 for high correlation and 0 for no correlation. In this case we're looking for stocks that hardly veer either side of a straight trend line at 45 degrees going left to right on the chart
These are some observations from Stockopedia’s Stock Rank Performance History focusing on US Stocks.
(I have used a 10-year period and rebalancing “Annually”.):
US Large Cap (Over $2.5b) :
S&P500: 193.85%
Stock Rank 90-100: 116.42%
Comment: underperforms the benchmark, which is a little disappointing and perhaps surprising.
US Mid Cap ($350m to $2.5b) :
S&P500: 193.85%
Stock Rank 90-100: 117.67%
Comment: very similar, (disappointing?) results
BUT THEN, Using a QM RANK, rather than StockRanks:
US Large Cap (Over $2.5b) :
S&P500: 193.85%
QM Rank 90-100: 209.87%
Comment: outperforming the benchmark, but not by a lot.
US Mid Cap ($350m to $2.5b) :
S&P500: 193.85%
QM Rank 90-100: 208.9%
Comment: outperforming the benchmark, but not by a lot.
I was also rather surprised to discover there is almost nothing in the comparative performance of Large and Mid Caps – going against the grain of the notion that elephants don’t gallop. However, the main reason for posting this in the context of the thread, which is about smooth momentum, is to suggest that a better universe to start screening might be to focus on high QM stocks, as opposed to High StockRank stocks. It may yield better performance results and increase benchmark outperformance?
Elephants do gallop in the US markets. NVIDIA (NSQ:NVDA) is a 10 bagger in just over 2 years. The S&P500 is weighted, the big 7 have a large influence on it.
I have found quite a few errors, with these Stockopedia figures, so l would not rely on them too heavily. Share splits and delistings can cause havoc. Same with the Guru screens.
Good points, well made; thanks. On a quick check of the same parameters over a 6-month period, very similar peformance patterns emerge for the large caps, but a QM score of 0-10 is currently outpeforming all else for midcaps!
Of stocks currently on my radar, ALAB, MSTR, SOFI and SOUN have been dismissed by Stockopedia as "Momentum Traps", but they have been great performers over the past 6 months or so.
I can see why they are classed as Momentum Traps, they are all loss making, at the last results. Momentum traps can do well but some will crash and burn, some will turn into High Fliers or Super Stocks.
Momentum Traps have not done well in the US, only up 41% since inception. They had a good period up until early 2021, since then it has been downhill, although the last 3 months have been good.
As promised here's how I calculate the math needed for the functions, outlined in Clenows book, in google sheets using googlefinance data for stocks and a few neat formulas. Apologies if Im teaching you to suck eggs. I'll try and keep it as brief as possible as some formulas require further explanation if you're not familiar with them.
My formulas are in A column and U thru AA, this is purely historical and you can use any cols you like. All formulas begin with the equals sign. SHEETS.NEW opens a new sheet on the Chrome browser. NOTE: you dont need all the formulas but there for reference. Also, I'm using a 90 day lookback period
In column A you need numbers starting 252 thru 1 starting with 252 (number of trading days) in cell A2. Quite a nifty formula for this is:
=QUERY(ARRAYFORMULA(ROW(A1:A252)),"SELECT * ORDER BY Col1 DESC")
Next Column U contains the ticker for the stocks you're interested in, preceded by LON: for UK stocks e.g. LON:BT.A for British Telecom
V column holds the googlefinance function to give the close price in U:
=GOOGLEFINANCE(U2) then copy down for other tickers in the column
W holds the Log number function:
=LN(V2)
or use the function to get the Log for the whole column U at once:
=ARRAYFORMULA(ifna(IF(U2:U="","",LN(V2:V))))
X column gives the exponential slope (this is where Column A comes in):
=ifna(IF(U2="","",SLOPE(ARRAYFORMULA(iferror(LN(query(QUERY(GOOGLEFINANCE($U2,"CLOSE",$T$4,$T$3,"DAILY"),"SELECT Col2 ORDER BY Col1 DESC LIMIT 90",0),"SELECT * limit 90")))),$A$2:$A$91)))
$T$3 holds the formula:
=today() which is todays date, and $T$4 holds:
=today()-365 date a year ago
or alternatively
=T3-365
Y holds the annualised slope:
=(POWER(EXP(X2),252))-1
or to calculate the whole column with one formula in cell Y2:
=ARRAYFORMULA(ifna(if(U2:U="","",(POWER(EXP(X2:X),252))-1)))
Z column holds the formula for R-squared: =
=RSQ(ARRAYFORMULA(LN(QUERY(GOOGLEFINANCE(U2,"CLOSE",$T$4,$T$3,"DAILY"),"SELECT Col2 ORDER BY Col1 DESC LIMIT 90",0))),$A$2:$A$91)
and finally in column AA if you want the Adjusted Slop simply multiply Y by Z*100:
=Y2*Z2*100
or with one formula in AA2 for the whole column:
=ARRAYFORMULA(IFERROR(ifna(IF(U2:U="","",Y2:Y*Z2:Z*100))))
I'll put a cut down spreadsheet together with all the formulas and post a link
Paul: I have replicated your sheet, following your instructions. It works great - so they are spot on and very clear. Big thanks from me!
One question: if, for example, I want to change the lookback period from 90 days to 180 days, which cell(s) do I adjust? Is it only the formula in Cell X2, where I see "limit90"?
Yes that should work, probably too long a lookback tho. You can also reference a cell with the value in it. e.g. in cell T5 put 180 then change the 90 with "&$T$5&"
That way you can test different values
Great, thanks for the prompt and helpful reply!
I realised yesterday when looking at the FTSE100 and SP500 stocks that you need to consider the Adjusted slope too. R^2 might be high e.g. above 0.7 but it doesnt tell you the direction of the trend! Adj slope -ve with a high R^2 indicates a strong trend down e.g. BME
I found this discusson very interesting, especially the helpful comments regarding the possibility of setting up in Google Sheets. The attached image is a screenshot of my attempt to do this, and seems to be working well. I used weekly closing prices over 6 months. The two columns on the extreme right compare (R2 and slope values for) the most recent 3-months with the whole 6 months: to gauge whether trend is strengthening/smoothing or not. I got a lot of help with formulas from ChatGPT, as I am no expert!
For R2 and slope I used conditional formatting to highlight cells where R2 and Slope were greater than 0.8. I'm happy to share the formulas used for each cell in Row A2, if of help to others. Of the examples shown, ROAD ticks green on all six criteria.
That's a great looking spreadsheet, Saucepan!
It's interesting to see the different approaches people take to this momentum strategy. Having just finished reading the Stocks on the Move book, I found a python script online that tries to replicate the strategy employed by Andreas Clenow, not just in stock selection but also position sizing. The script was a few years old so some things no longer worked, but I've managed to hack it to get it working again. I tried running it on the universe of US stocks (with a lookback of 125 days), and with some further selection (removing stocks where the price is so high the position ends up being less than 10 shares, Stockranks < 75, QM < 85) I ended up with the following:
DASH
ENVA
FDP
EXEL
CBRE
PYPL
PLXS
CSWI
FTDR
CNK
UAL
CORT
VSCO
I've added them to a mock portfolio to see how they perform going forward.
Will be interesting to see how they compare to Ed's selection, not much overlap. Ed's are off to slow start, down 3% on the S&P500, early days.
Yes some US prices are too high, puts me off buying them. On folios l tend to use $10,000 rather than $1,000. Is Booking Holdings (NSQ:BKNG) excluded for that reason?
Make that now 5% down, down 1.9% today, some are taking a pasting. Nearly all the top risers this year, in the US markets, are well down today. I don't know why.
I'm not sure why Booking Holdings (NSQ:BKNG) was excluded, it didn't appear in the final list (before I applied my rules). The script will exclude any stocks that have had a rise of 15% on any given day during the lookback period, as well as any that have crossed the 100MA. It is also limited to selecting the top 50.
For anyone interested in Python, the script I found is here:
https://github.com/skyte/momen...
It doesn't work as it is, some tinkering is required to get it to run without error.
Ed, what has happened to the folios that contain US stocks? My old one is based in £, but the rates of exchange, after the close are wrong, seems to be using around $1.32-1.36 to £. Before close they were correct, l wondered why my profits dropped after the close.
Also on my recent US folio, it is in US$s, neither folios currencies can be changed.
If you're a fan of Clenow or just linear regression, you can get R-Squared and the Adjusted Slope in Tradingview (Scripts: Chande Kroll R-Squared Index and Exponential Regression Slope Annualized with R-squared Histogram). Histogram shows the projected gain if stock continues the trend it's on, scale on the left, in this case 200% for International Consolidated Airlines SA (LON:IAG)
Thanks Paul for the guide to Tradingview scripts, very useful for me. I need to spend a bit of time understanding the Exponential Regression Slope Annualized with R-squared Histogram aspect.
Many thanks for the article on US stocks similar to the ones I recently enjoyed on trending UK small and mid-caps. I have come on board to Stockopedia, divested of all North American equities previously held in an S & P 500 tracking fund and L&G Global Technology fund, which relied far to heavily on the "magnificent 7" American Big Technology companies, with mind boggling valuations disguising the true state of the American economy, about to be sabotaged by Trump and his love of cryptocurrency and protectionist tarrifs. Your suggestion that there may be some hope in the rest of the economy will ensure I upgrade my subscription to include North America and look forward to the heady returns I once enjoyed through some Baillie Gifford funds in this market.
If you look at the chart for the Top QVGM rank for the UK it clearly beats the FTSE All-Share
But in the USA, the S&P beats the Top QVGM
I suppose that is because the highest performing shares are excluded because of value. Are you better of just holding and S&P ETF. There is an up tick in the blue line recently.
The S&P is weighted and some of the best performing stocks are also the largest, see NVIDIA (NSQ:NVDA).
If you look at just Momentum, l think that has done much better than QVGM top stocks in the US. G is often excluded as has not performed well. Actually Growth has done better in the US, big hit in 2022 though.
Top Momentun US stocks are up 416%.
If you want a killer solid screen just filter
:-net debt latest less or equal to 0 (so a negative number meaning no debt)
- increasing fcf year on year for last 3 years (the advanced compare rules). Show they making cash
1)Free cashflow TTM greater than 1 x free cashflow 1 year ago
2)Free cashflow 1 year ago greater than 1 x free cashflow 2 years ago
3)Free cashflow 2 years ago greater than 1 x free cashflow 3 years ago
Same for sales
1)Sales growth TTM greater than 1 x sales growth 1 year rolling
2)Sales growth 1 year rolling greater than 1 x sales growth 2 year rolling
-Market cap greater than 50 million to filter out the penny stocks
- Spreadbps >400 so a maximum 4 % hit on commission when you buy (difference between the buy and sell price)
I then look at the chart view and look at 1 year,3, year and all and look for a 45-55 degree angle long term going up. I play with removing net debt filter as some films with high debt do rocket too
US has far greater opportunities than UK now with trump coming
this is a perfect angle and a for a whole market coverage decent growth
SPDR S&P 500 UCITS ETF (LON:SPX5)
SPDR S&P 500 UCITS ETF (LON:SPX5) Incredibly low daily volume.
I have made a ton of cash from US recently. One major difference is share price tanking after earnings. I sell before earnings now in most cases on larger well known. Nvdia I got burnt as it tanked over 30% on good earnings, sometimes there's no logic in it and it must be algo /AI generated to trigger the sell off
Trump will rip a lot of existing laws. Waste management laws are interesting and Im looking into the clean water act and the Regulatory Changes: Anticipated shifts in environmental regulations, such as potential rollbacks of PFAS-related laws, (these are the toxic chemicals in plastic that leak into the soil and water basis). These are firms that have a moat that were rising but will be interesting to watch them. You can see a slight drop when trump got elected as fear about pfas laws being scrapped.
Aecom (NYQ:ACM)
Parsons (NYQ:PSN)
Clean Harbors (NYQ:CLH)
Enviri (NYQ:NVRI)
Casella Waste Systems (NSQ:CWST)
Jacobs Solutions (NYQ:J)
Tetra Tech (NSQ:TTEK)
Montrose Environmental (NYQ:MEG)
Trump did have his own clean water bill but I think immigration is his main goal which brings me to these of which I made 82% in geo on the day after he got elected. History repeats itself and I looked at shares that went up in 2016. Private prison shares. I bought geo at 18 and sold around 28 and kept dipping in and out. They are at all time highs so not sure if they will go any more but the Geo group was a rocket
Geo (NYQ:GEO)
Corecivic (NYQ:CXW)
Then you have ukraine that trump sais he will stop funding. biden is now ramping up weapons and flooding ukraine with them before trump gets in , these are up a lot and will be need the stockpiles replacing , the earnings will be a beat on all of these. some are up nearly 100% ytd
Curtiss-Wright (NYQ:CW)
Joby Aviation (NYQ:JOBY)
VSE (NSQ:VSEC)
Moog (NYQ:MOG.A)
Embraer SA (NYQ:ERJ)
Howmet Aerospace (NYQ:HWM)
when the war ends then Ferrexpo (LON:FXPO) a uk mining stock will take off as well as possible US Caterpillar (NYQ:CAT) for the rebuilding and uk building firms CRH (LON:CRH)
Other general ones to watch Now (PNK:NWPN) , amazing growth and LATAM Airlines SA (NYQ:LTM) (back from chapter 11 due to covid ), could take years but like International Consolidated Airlines SA (LON:IAG) LATAM Airlines SA (NYQ:LTM) has just ordered another 10 planes on top of the 350it has. Was trading at 1000 for ages so at 28 , its a long term hold ,although with the risk of dilution but it has the latin market. The massive number of "average shares" from 10,000 to 600,000 is like confetti so could be diluted again.
International Consolidated Airlines SA (LON:IAG) is recovering and I held that for 5 years nearly so maybe the trump shares at the top have better growth
Great post thanks.
Very grateful for this post - thank you
With the unmanageably huge deficit in the USA, maybe countries will stop buying US Treasury bonds and that will be the catalyst for a correction?
It does feel like now is a bad time to move into the US market, but I've thought valuations were too high since 1995!
The S&P 500 is up about 50% in the last 2 years, so it is looking pretty expensive now.
The beauty of having a multi market approach is that you don't think of the US as a market rather your screen generates potential investment candidates from the UK, EU & US. If the Quality, Value or Momentum (or whatever criteria you are seeking) fails in the one region then you stop receiving candidates for that region from your screens. For example over the last three years I've held very few UK stocks.
Some UK stocks have done very well in the last 3 years, such as Yu (LON:YU.) Rolls-Royce Holdings (LON:RR.) Marks and Spencer (LON:MKS) Warpaint London (LON:W7L) plus a host of others that are up over 50% this year. Most of these still look quite good value unlike many US stocks.
Why are your screens not selecting UK stocks?
because I havent needed to purchase any is the first aspect
but here's the result of running my screen and UK stocks are few and far between...
I do hold Games Workshop (LON:GAW) it has done ok but looking quite expensive now, there have been far better performers.
If anyone is interested, I can put something together that shows you how to calculate R^2 in google sheets on the fly using googlefinance for a list of tickers
That would be very useful
Yes please. Someone did this on one of Ed's other UK posts but was getting different stocks from Ed. I'm just looking at the minicharts at the moment.
It is quite easy to pick out the smoothies, such as 3i (LON:III).
That was me! Happy to also share and compare my calculations. I did get different results to Ed, which could be down to many factors. But would be interested to see what you have done Paul.
Hi Paul, is the Correl formula from Google Sheets equivalent to R2?
Yes. Correl and RSQ give the same result in sheets
Cheers Paul
Sorry. You have to square CORREL to get same value as RSQ
Maybe I'm being dumb, but the R Squared function takes in 2 parameters:
RSQ(data_y, data_x)The range of prices would be 1 parameter, but what do you populate the 2nd parameter with, i.e. what is it correlated to?
A range, a perfect trend in this case of numbers 252 down to 1 (252 trading days)
e.g. in a spreadsheet populate A1:A252 with 252 all the way down to 1 in cell A252.
RSQ($A$1:$A$252,$A$1:$A$252) gives a value of 1 so you measure your stock data against this. The closer to 1 the clearer the trend is, in this case it's perfect. The clearest trend for an actual stock ive found recently is SFM, so you could measure against that instead.
Say in B1:B252 you have the daily closing prices for your stock in descending date order for the year, then RSQ(B1:B252,$A$1:$A$252) gives the R^2. Change the 252 to whatever period you're interested in
How about Trane Technologies (NYQ:TT) that looks even better to me.
For UK, 3i (LON:III) takes some beating. Marks and Spencer (LON:MKS) pretty close.
Not even close. SFM R^2 pretty much above 0.8 since February
I don't get it, it is a flatter straighter line than Sprouts Farmers Market (NSQ:SFM)
Your eyes deceive you ;-)
The plot of R^2 is flat and high for a long time with Sprouts Farmers Market (NSQ:SFM) whereas Trane Technologies (NYQ:TT) went sideways for a while in price hence the R^2 is up and down. Also the trend line for the plot of R^2 is steeper. If you plot them both together you can see SFM is smoother and steeper
I'm looking at the 1 year chart:
Sprouts Farmers Market (NSQ:SFM) went up 24% in November.
Yes. You want the steeper plot which is SFM. SFM has trebled whereas TT has 'only' doubled in a year. Which would you rather emulate? Beats MKS and III
MKS beats III last 6 months or so
Just because one has gone up more than the other in a year, does not mean it will repeat the performance, l would favour the one that has gone up less, usually better value. Sprouts Farmers Market (NSQ:SFM) is looking expensive. The growth forecast is only 17%.
As for 3i (LON:III) and Marks and Spencer (LON:MKS) l like the steady climb, not getting ahead if itself.
The stocks are irrelevant. It's the math that's important . We're only looking at trend clarity and the concepts around it. Winners keep on winning especially in a bull market
The best performing stocks in the past year are rarely the best performing in the next year. Look at Super Micro Computer (NSQ:SMCI) that was a multibagger but has crashed, it was 80% from 52 week high. Shopify (NYQ:SHOP) fell around 75%.
There is a reason why Ed is not picking the lower valued stocks such as NVIDIA (NSQ:NVDA) .
The UK is littered with such examples even well established stocks such as JD Sports Fashion (LON:JD.) lost 60%. Fevertree Drinks (LON:FEVR) down 80% from peak.
I find the stocks with the steepest rise often have the sharpest falls.
Over 2 years Rolls-Royce Holdings (LON:RR.) has outperformed Sprouts Farmers Market (NSQ:SFM), so that goes against your theory. Maybe Sprouts Farmers Market (NSQ:SFM) will benefit from Trumps policies?
Ed's selection did not outperform the S&P 500 until November.
I think we're moving away from your original question which is how to determine trend clarity. Depending on what timeframe you choose i agree Rolls-Royce Holdings (LON:RR.) has performed superbly with a marginally stronger trend (i've chosen R^2>70 as a baseline) over 2 years and 500% +gains in price. Sprouts Farmers Market (NSQ:SFM) has gained alot more with a much stronger trend based on the R^2 plot over the last year with a 244% gain and R^2 over 0.7 87% of the time. It's a method that gives you confidence that the trend will continue even if the prior gains are high. After all, would you have bought after RR. had done over 100% in October 2023? Probably not, but the trend was still strong and has almost trebled since
I bought Rolls-Royce Holdings (LON:RR.) in August 23 at 202p. I did not know about Sprouts Farmers Market (NSQ:SFM), the low margins would probably have put me off, lack of forecast growth as well, to be honest l'm baffled why this stock has gone up so much. Look at the Stockreports around October to December, 2023.
SFM is just an example of a strong trend, doesn't matter what it is
Good point regards getting back to the trend clarity question. I read Ed's bullet "Calculate the trend clarity for each. (Linear regression → R2)" as similar to Clenow's Stocks on the Move book. In that Clenow gets a 90d R^2 figure and multiples that by the annualised 90d return. Appreciate Ed didn't use the return multiple, but I used a single R^2 figure based on a particular lookback period (e.g. 90d, 6M, etc). In your graphs you show R^2 over a period of time, so assume you're measuring it on a daily basis rather than a single point in time (today-lookback period)? Are you then using the daily R^2 chart (including R^2 trend line) for the basis of your selections? Also what lookback period are you using for R^2?
Also the other thing to note is that Cernow and others have all said that for this type of strategy to work you need to work with "total returns" data not plain "share price" data normal found on the internet. The reason is that dividend paying stocks will have a "false" price variation (the standard post dividend share price drop) that impacts R^2. Whereas a non dividend stock that has the same yearly total returns will have a better chance of a good R^2 score as it's not hit with the post dividend dip.
I'm using 90 days like Clenow does for consistency. I then compare stock price data over 252 trading days + 90 days and compare it against a fixed 1:252 range (gives a straight line at 45 degrees left to right ,a proxy stock with a perfect trend if you like) in a spreadsheet to get the R^2 plot. I had nothing to compare it against until I discovered indicators in Tradingview for R^2 and the adjusted slope and I get the same result thankfully (see screenshots) so I must be doing it right. Clenow says to buy based on the highest adj slope then work down until you run out of money but I find breakouts to be more intuitve where the R^2 and adj slope are rising indicating a developing trend e.g. On Beach group (LON:OTB) which is in my multibagger screen + travel is a hot sector (IAG, IHG for instance).
With M&G (LON:MNG) you could use a bit of Technical analysis and say its performing a higher 2nd peak then 3rd peak, ok the trend is getting stronger and R^2 stays high
On the other hand,with Pan African Resources (LON:PAF) for instance you can see the peaks are getting lower and R^2 is pointing down and going below 0.7, so perhaps the trend is weakening
Screenshots for M&G (LON:MNG)
M&G (LON:MNG) l don't think so, maybe Morgan Sindall (LON:MGNS) ?
Re Pan African Resources (LON:PAF) could be a Volatility Contraction Pattern (VCP).
I think there's a total return data option on Tradingview. I prefer to look at weekly charts initially so divis wouldn't make much difference imo. So long as the R^2 is at a certain level or maintaining one then you get an instant idea of how strong the trend is compared to others. You're not just relying on your eyes to get a feel for the trend
Thanks again Paul. I never knew Trading View had that functionality. For reference it's the ADJ button in the bottom left of the chart screen.
Great article Ed! Stockopedia has played a massive part in being able to achieve those returns. Thanks to the team!
For those that are interested, my approach is ...
1) Divide my portfolio equity value by 10 to decide how much I wish to invest per stock
2) Run my screens to find high QM candidates (whether they are UK, EU or US) that have increasing broker estimates for the current and next year (this is already a contributing factor to the Momentum Rank)
3) Select my preferred candidates. I want stock that are in an uptrend, close to or setting recent highs. Winners, keep winning!
4) Buy the stock in GBP (through AJ Bell)
The US market loves stocks that keep beating market expectations.
"I do no company research beyond the output of the screening process."
I'll repeat that as it makes a lot of people who think you need company and/or business knowledge to invest a little unsettled ...
"I do no company research beyond the output of the screening process."
I so wish I could teach every kid that!
I sell stocks if:
1) They release bad news
2) The share price drops unexpectedly without a wider market pullback
3) The share price stalls for an extended period and quality and/or momentum falls.
I don't care about exchange rates in fact by owning stocks in multiple currencies I'm spreading risk.
I know I will lose some interest as a result of withholding tax but I'm more focused on capital growth than dividend income.
Hope that helps
Phil
Hi Phil - I saw that Ed mentioned you and your approach in Thursday's webinar - such stunning results! I 'm really intrigued by your approach - I didn't see your rules in the webinar and I know this is cheeky but is there any chance in sharing them?
Could anyone be so kind and screen shot the Rules , I'm still finding my way setting up screens. I've done the UK Small & Mid caps screens
I would also benefit from someone setting out the rules! It sounds interesting (and I am very sorry if they have been set out elsewhere, my other half always tells me I don’t look properly…)
They are in this article: https://www.stockopedia.com/co...
"
You’re a star, thank you and as predicted I didn’t look properly!
Problem is calculating the trend clarity.
RSQ Function in Google Sheets may be of help in giving a numeric value for trend clarity.
Did you manage to set this up?
Interesting article Ed, thanks for posting.
Question for those who invest/trade in US stocks - how do you factor in currency exchange rates to your decisions, if at all?
I'm wondering how a similar search in Europe and Asia would pan out. I've noticed Stocko' offers these markets as areas for research was considering a subscription to see how things worked out. I'd be very wary of the US now as the valuation heads into nosebleed territory!
My apologies for this post - it may come across as being political which is not my intent. The question I would have about the us is that there is considerable uncertainty around Trump. The market seems to be signalling possible recession. The policies being touted are unlikely to grease the wheels of commerce. Inflation plus shortages are more likely. Is that going to be a good environment for US stocks? Will they be able to sustain their attractive returns?
Until policies are implemented, it's all just speculation.
Personally, I think most of what Trump says is bluster, and is mainly used as a blunt instrument to get the deals he wants.
I will also never invest in the UK again, its clear the US is a major global driver - and Im tired of the profit warnings in the UK
Im still transitioning out, but Ill never come back to UK investing - why would anyone choose a poorly performing market when international share buying is the same.
I've been playing US via IT/ETF since 2019. About the time I started giving up on any hope that the UK would catch up. Since then I haven't really been heavily invested in anything UK apart from a couple of conviction/story stocks. I did a new QM based mid cap portfolio in October and up and amazing 10% since then. Ed, have you compared your strategy against the rules in the book? Also have you tried a risk parity sized portfolio? From reading the book he infers that's the main reason for success, all the other rules are fine tuning.
Dave - which book are you referring to?
Sorry Ed, my apologies I thought you referenced it but it's in the comments from Greedo a good easy read that hasreinforced what you are doing here. https://www.amazon.co.uk/Stock...
I can provide a summary of his rules if that's of interest.
I have a copy of the book. From memory he does a double sort on an exponential regression slope plus the r-squared for fit. So you end up with generally strong, generally smooth trends. Nothing wrong with that approach.
Well remembered! He actually multiples annualised 90d return by R squared and sorts on that score but the results are as you describe. The interesting thing he does that I hadn't considered before was risk sizing the positions in the portfolio. He alludes that this is essential for performance. Have you ever considered that rather than equal sized (by value) portfolio?
Had a quick look at these, the thing that surprised me was the lack of growth, why are the prices so high, if the forecast are around 20% or less? I get NVIDIA (NSQ:NVDA) because their growth is incredible. But most of these have PEGs well over 1. Maybe l'm missing something?
I wouldn't say there's a lack of growth. Median historic growth is around 48% (although three are without earnings I believe) and median forecast growth is about 15%.
Momentum stocks are normally indicating underlying earnings momentum. The median earnings surprise is 15%, and 3 month EPS upgrades of 2.5%. So perhaps earnings forecasts will prove understated.
I agree the PEGs aren't low. Slater fans will be disappointed. What backs up these stocks are strong showings across the combined QVM frame. Yes they are on premium valuations, but in general strong profitability and earnings momentum appear to be driving broader ownership.
Either that, or they are just Big Mo Trades best handled with care. i.e. the mo returns may continue for 6 months, but fundamentals may mean revert.
I mean lack of growth considering the rise in share price over the last year.
I see only 1 stock qualifies for the Slater Zulu screen, this in both the UK and the US markets.
NVIDIA (NSQ:NVDA) despite very low value rank, has a PEG of 0.9, earlier this year it was 0.7, when VR was only 1, that was when some were saying it was a crazy valuation. I don't hold anymore.
You maybe right about forecast upgrades. I have a screen for EPS upgrades.
The UK only has 12 stocks on it, the US has 232 stocks.
US forecasts tend to be more managed.
Thanks Edward.
What were the criteria for your US selection? Do you think there’s any advantage in including a value factor, just to show there’s something left in the tank - say Value Rank > 50?
cheers
There's a StockRank 80+ cutoff, so there's a third element of value in there. You often find with momentum stocks that they trade on more premium valuations. The same process could be run using the VM rank which will offer a little more value bias, but you will find the sectors skew to more value-trappy sectors. So they come with tradeoffs.
8/20 do have a VR > 50.
Like many of us I had avoided U.S individual stocks as over valued. Recently I have put my toe in the water I’ve bought some U.S. Q V M large and mid caps, I intend to buy more as I get more confident. Your US articles are much appreciated. My portfolio comprises of: 50% UK Mid Caps, 25% UK Small Caps, 10% UK Large Caps, 8% US Large Caps, 8% Mid Caps and 4% UK Micro.
Hi Ed
Thanks for the article.
I held Sprouts Farmers Market (NSQ:SFM) for 2 years before selling out last month. It was a difficult sell after registering >200% gains in that time.
It was obviously a wonderful holding, however I could no longer understand the current valuation, which is why it was so interesting to see it appear on your updated list today.
A few quick points:
Admittedly the above numbers don't tell the whole story, but it seems like the share price is out of sync with a reality that I see and completely driven by momentum.
I'm not sure what the catalyst could be, but I'd be scared to hold knowing that the current valuation could justifiably and rapidly reverse at any time.
A
abtan - congratulations on the Sprouts investment return. Outstanding.
Sprouts does have exceptional margins and profitability for a food retailer. 6% operating margins (compare Walmart at 4%). That reflects its shift towards differentiated premium product ranges that can only be found in their own stores. I guess the market appreciates that strategy.
Is there a Nick Sleep style "Scale Economies Shared" going on with Sprouts? . Costco is on 53x forecast earnings because every fund manager thinks it's the best company in the world... but growth is 8.5%, half of Sprouts!
I do agree - it's too pricey for me!
The outperformance of trended momentum in the chart you provide is limited to the period after the presidential election. Do you think the favourable outcome is more likely to be due to the sector bias that your process has introduced interacting with a Trump effect to create the illusion of outperformance?
The book Ed references in the original article thoroughly backtests the performance of a trended momentum system (with different rules) from 1999 to 2015 with good success. So personally I don't just put the moments strategy success just down to recent events.
DWit - Yes it's clear, these stocks do seem to be Trump effect beneficiaries.
I haven't really thought about why. Yes there is a sector skew - see below, but it seems underweight may of the "deregulation trade" areas like banking, energy, big tech and so on.
In my experience there was a big uplift after the election however my two biggest US winners: Celestica (bought Nov '21) & Limbach Holdings (bought June '23) were already flying.
Deleted.
Is there an ETF that holds many of these?
I hold Celestica (NYQ:CLS) as well, but sold most now. don't think it is up 740% this year. You can get some big winners in the US markets, my best one was probably Super Micro Computer (NSQ:SMCI), that 10 bagged in a year, March 23 to March 24.
My US folio is way ahead of my UK one, over the last 2 years.
My UK folio was doing alright this year until September then it fell back.
I have added Pilgrims Pride (NSQ:PPC) today. It's been on a few screens of mine for a while and I've finally pushed the button. I have a feeling that a trade deal with the US will attract a lot further business opportunities in the UK to start and will penetrate further.
It already is established here and I can see a clear runway for it when prices start pinching.
Loving these articles and the increased non-UK focused articles in general.
100% agree with Carey, Ed.... this is exactly what I was politely requesting on the main 'Small Cap ' thread ... many thanks indeed
Hi Ed
A brilliant article thank you. I have long felt a decent exposure to US stocks is a good move, but worry about being too late to the party & scale of US debt. But if the Bond market worries about the debt I guess most other markets will sell off too, so that's not a reason to avoid US. As I'm semi retired my risk appetite isn't what it might have been if I'd started earlier. So I have played the US market mainly via IT's & ETF's - JGGI, DFNG & SWDA which have all done well this year. More recently, I have bought starter stakes as an experiment, hoping for a rebound, to top up - which of course hasn't come , apart from MELI & Nu. (which are really South America businesses). Holdings are
Ameriprise Financial (NYQ:AMP) MercadoLibre (NSQ:MELI) Kinsale Capital (NYQ:KNSL) Brown & Brown (NYQ:BRO) Copart (NSQ:CPRT) Visa (NYQ:V) Medpace Holdings (NSQ:MEDP)
I'm up about 12% in 3 months on this bunch & wish I'd bought more to start with. I am looking forward to researching your list.
Just bought a small stake in Star Bulk Carriers (NSQ:SBLK), mainly for the well covered divi. Interactive Investor let you keep cash in US dollars, whilst HL FX back to £ all the time, which is a pain.
Thanks for that Ed - I have often felt that by sticking to the uk and staying in my comfort zone I was missing some great opportunities and not just on the apples etc but lower down the food chain, which this seems to suggest. I’ve never seen your US stock reports but could someone give me some information on this - cost etc
Many thanks
Thanks for this Ed. I have been dipping my toe into the US market with Centrus Energy (ASQ:LEU) a sector play on nuclear energy. Volatile stock but up 70% in the last 6 months. Recently opened a starter position in Archer Aviation (NYQ:ACHR) a pre revenue business tipped as the Tesla of electric vertical take-off and landing (eVTOL) aircraft. It is generating interest from the UAE and others with contracts signed. This was suggested to me by a former IFA in the US and now the owner of a coffee shop in Vernon near Paris. A conviction buy from him and too tempting to resist. Up 45% in 15 days!
Archer Aviation (NYQ:ACHR) up 15% today.
I did hold Centrus Energy (ASQ:LEU) l also hold Yellow Cake (LON:YCA) and Geiger Counter (LON:GCL), l don't understand why the US uranium stocks, slaughter the UK ones, put them all on a chart and you will see the difference.