
I understand that I should buy quality, value, momentum shares and the StockRanks are a good guide to this... but I've still got a major problem when should I sell?
It's a very good question. It's all very well thinking "90+ StockRank shares tend to beat the market" and buying 90+ ranked shares accordingly - but managing a portfolio of shares on this basis poses real questions. The rank for a high ranked share will tend to fall over time, so it's highly likely it will cross below the 90 level within any reasonable investment timeframe - often within weeks or months. When is the right time to sell?
I'll cover two approaches to answering this question using the StockRanks in fully invested portfolios - periodic and threshold rebalancing. I'll introduce some key rules of thumb from a fascinating recent research paper that anyone can apply. What I won't cover is sell rules used by more active strategies - such as stop losses, timing indicators or other fundamental sell signals.
Periodic Rebalancing
One solution I've long promoted is to use periodic rebalancing which ducks the question of when to sell by waiting till a point in time. The slow moving "NA
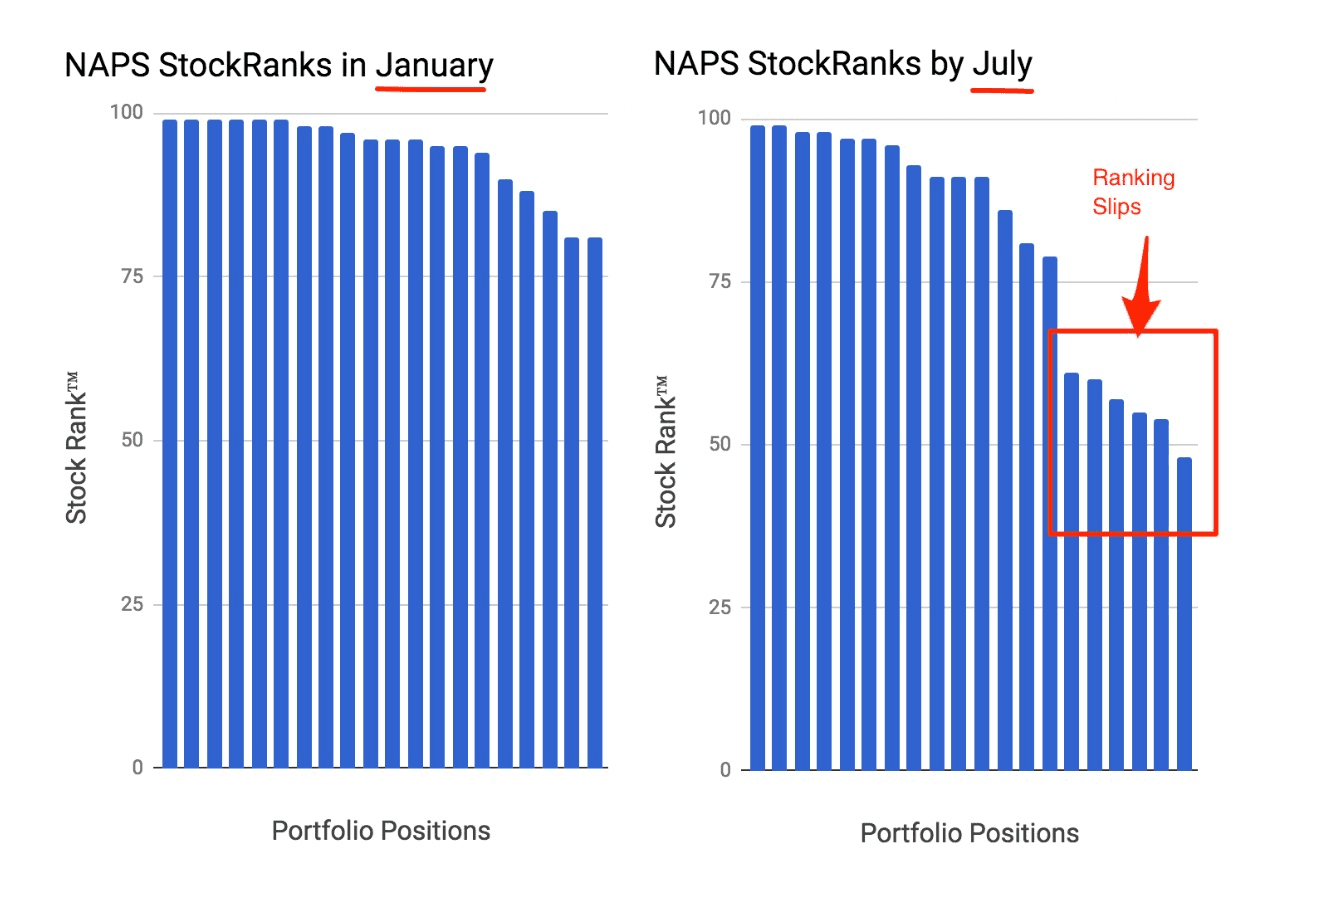
PS" investment process buys a portfolio of high ranked shares and rebalances them annually, ignoring any ranking movements in the interim. What tends to happen is that the ranks of the holdings drift downwards as the year progresses. Even at the half year mark you see a significant fall in the average ranking. This year's portfolio has already about 20% of the portfolio below a 55 ranking. But if you are rebalancing annually, you just ignore all this and wait.
I'm working on some research to investigate the optimal rate of rebalancing vs transaction costs which I'll share in future, but in essence annual rebalancing is very hard to beat.
But what if we want a more active approach to sell rules?
Threshold Rebalancing
The alternative is to use threshold rebalancing. To select a lower StockRank threshold at which to sell shares to free up funds to invest in higher ranked alternatives. Our own staff Investment Club had some discretionary set 'guard rails' within which Club members could pitch shares. We set the buy threshold as a minimum 75 StockRank and a forced sell threshold whenever the StockRank fell below 50. This forced sell rule was unpopular as everyone gets attached to their shares, but saved us from numerous losses. But these rules were set in a very ad-hoc fashion. Couldn't we be more rigorous?
While I haven't done the research on our own data yet - I have recently stumbled upon an eye opening research paper titled "Combining Factors" by Christoph Reschenhofer - PhD student at the Vienna Institute for Finance, Banking and Insurance. This is a great read for anyone of a geeky bent. It uses a framework not too dissimilar to the StockRanks and tries to answer these questions based on (essentially) a percentile ranking system.
In essence, and if you don't want to read the whole thing, here is the key rule of thumb:
For smaller cap shares....
Buy at a rank of 92
Sell at a rank of 72
The above rules work for his multi-factor ranking based on Value, Momentum and a couple of Quality factors (profitability and investment) in an equal weighted mix on US stocks. They take transaction costs into account and are optimised to find the exact ranks to maximise the risk/return trade-off (Sharpe Ratio).
For large caps, the rules of thumb increase to...
Buy at a rank of 94
Sell at a rank of 74
But in essence, they aren't that dissimilar. Here is a heatmap that illustrates these numbers for large caps. Let me explain how to read it:
Scan along the horizontal axis for the 'buy' rank.
Scan up the vertical axis for the 'sell' rank.
Green is 'good' - and indicates a positive risk/return tradeoff.
Red is 'bad' and indicates a negative risk/reward tradeoff.
The optimal risk/return thresholds are at the black diamond at 94/74.
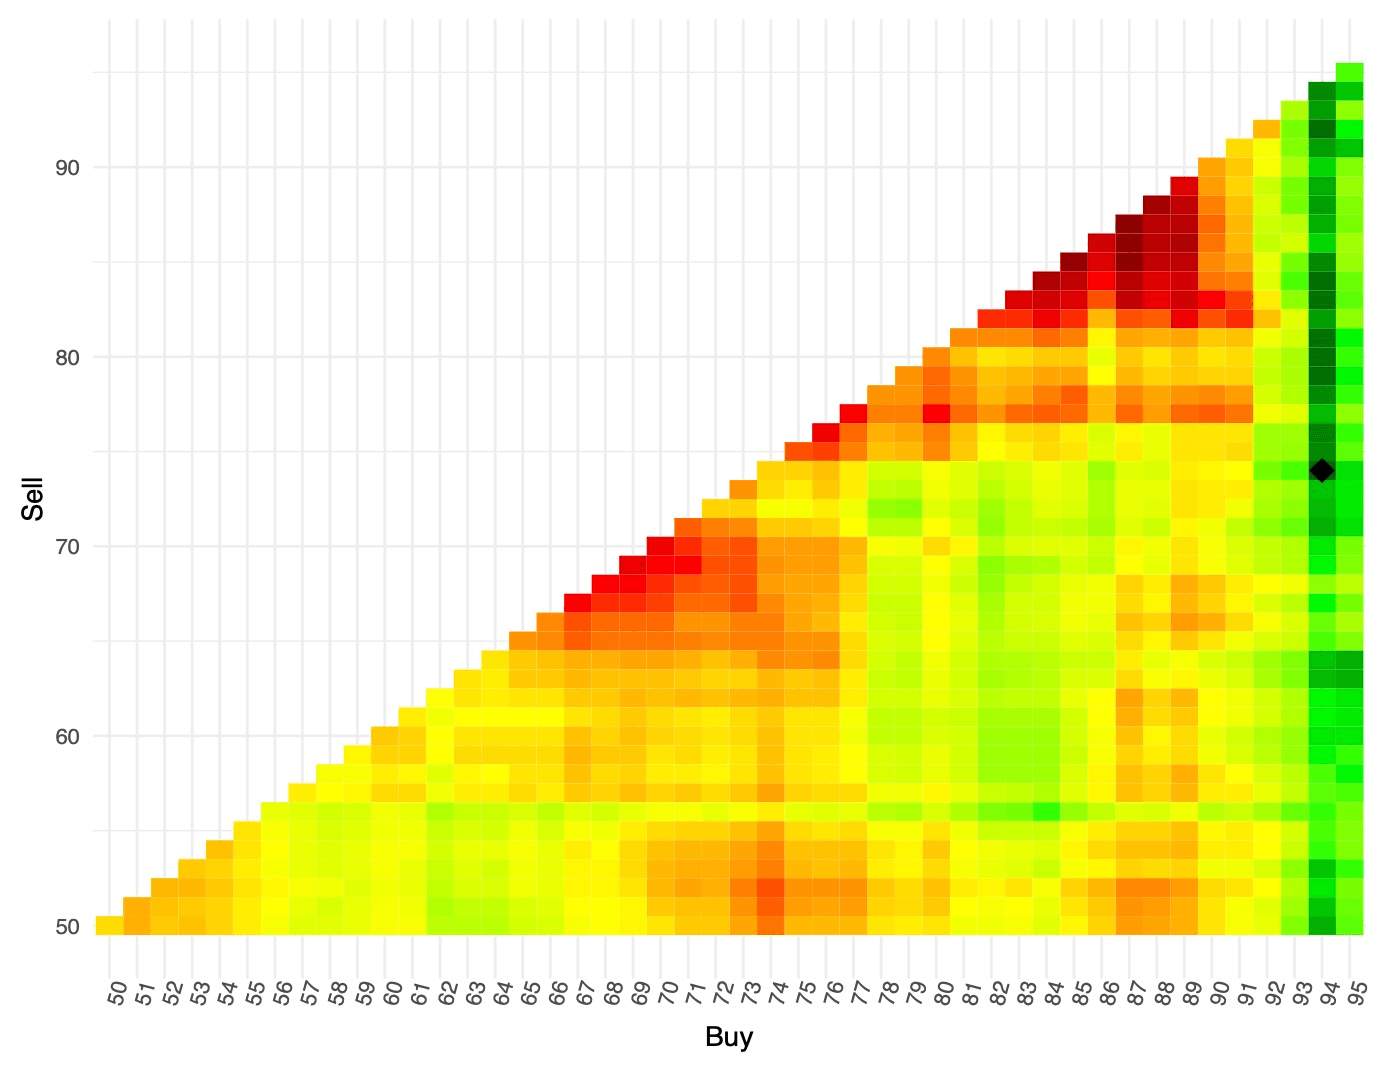
Clearly the "rules" above are optimal points in a range of good choices. Purchasing above ~90 and selling at any cutoff down to ~50 does work fine… but returns are optimised at higher sell ranks. If investors want to minimise transaction costs, choosing a lower sell cutoff doesn't lose that much in terms of performance.
Christophe found that the turnover of the portfolio in these cases was about once every 11 months. i.e. not that far off annual rebalancing. But Christophe also found that if you wanted to reduce the turnover further, you could use a filter to only include shares with a momentum rank above 50... this seemed to reduce the turnover dramatically to make the average holding period to 24-36 months. An unusual result.
Conclusion
There's a huge amount in his research paper, and lots to delve into. I am pulling out some rules of thumb above which are based on a different data set to the StockRanks so should be used with caution. These rules also are based on being continuously invested - so the aren't a timing model. Bear market investors beware.
Nonetheless I'm a huge advocate of finding sound rules of thumb and applying them in worlds of uncertainty. The above rules very much align with the kinds of StockRank levels that some of the best investors in the community have mentioned they use to me for optimal performance.
As a last point of note on the 'rules of thumb' topic, and for further reading, I can't recommend enough the work of Gerd Gigerenzer and especially his book "Risk Savvy - How to make good decisions" which is incredibly eye opening for improving choices in health, wealth and other areas of life.