How to review company operating results

Many esteemed investors consider a consistent operating history to be a prerequisite before purchasing a share. A quick scan of the company's financial history can ensure that you are not gambling on a poor stock but investing in one with a real business and sustainable business model.
The screenshot below shows an example of a company's operating overview on one of Stockopedia's StockReports.
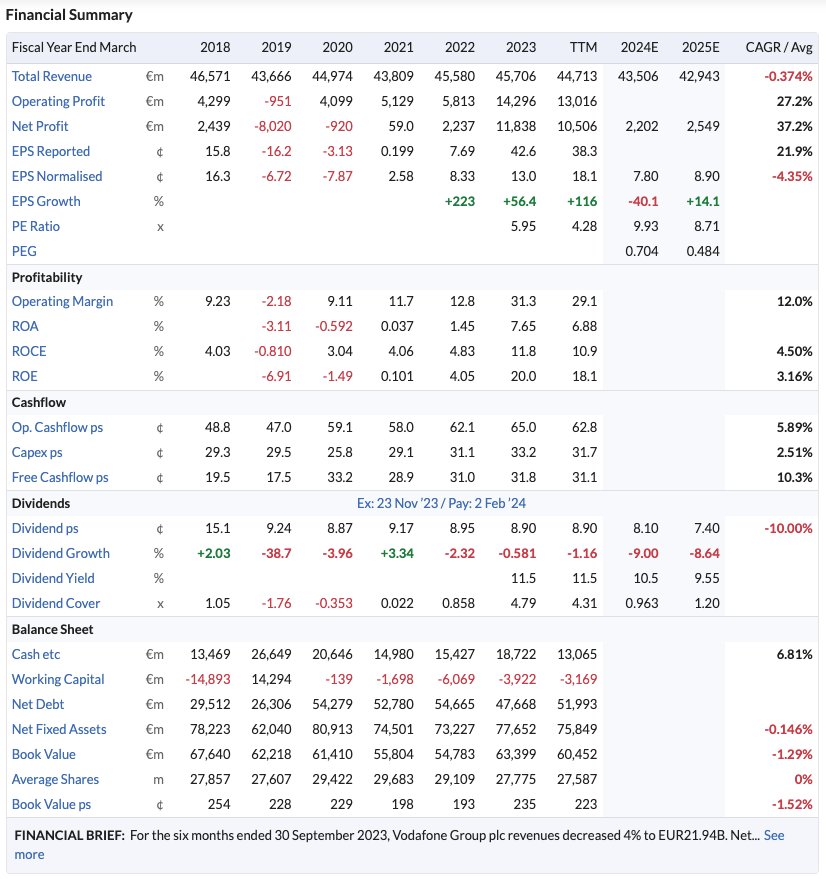
The ratios are grouped into key sets as follows:
Turnover and Earnings
While many companies can grow their topline and bottomline, many can't do it without destroying shareholder value. The important thing for shareholders is to look at sales and earnings growth on a per share basis rather than for the company as a whole. If a company is growing eps every year consistently at a strong and sustainable growth rate then it may be worth closer examination.
Quality
The very best companies show consistent ROCE and ROE figures of above 15% every year, strong operating margins likewise help to build a picture of a company that has a durable competitive advantage and economic moat. Investors such as Warren Buffett have indicated that these metrics are critical in finding great stocks.
Cashflow
Some companies report high profits, but they can't turn those profits into cash! A company can't survive without cash, and if it can't generate it internally it will have to go to outside investors to support it, resulting in either share dilution or increased borrowing. We show the Operating Cashflow on a per share basis - from that cash a company has to make capital expenditures to maintain its current business (capex) - the Free Cashflow left over a company can use to pay down debt, distribute as dividends, or reinvest to grow the enterprise (hopefully not at a low ROCE).
Dividend, Growth and Cover
When looking for income stocks, one also has to consider the safety of the dividend. Has the company grown its dividend every year without fail? Have they had to cut a dividend? Does the company have significant cover as headroom each year?
Net Current Assets
Also known as the working capital of the company. Some investors such as Benjamin Graham look for companies that trade for less than the value of their net current assets - bargain stocks.
Average Shares
Companies that dilute shareholders are often poor investments. By using this row you can find the worst offenders. It’s normally better to invest in companies not issuing shares, but buying them back - so look for decreasing shares in issue.
Reading the data in the StockReport
1. Reading the Columns
The columns all show the fiscal reporting year for the company which are either historic or forecast. If the company has reported interim or quarterly results since the year end there will be a “TTM” (trailing twelve month) column injected between the historic and forecast years.
There’s one last column titled “CAGR / Avg”. This either shows the Compound Annual Growth Rate (CAGR) essentially of any nominal currency denominated measure (e.g. Revenue, EPS etc) or the six year Average of any % performance measure or Ratio (e.g. ROCE, ROE, Gearing etc).

2. Reading the Rows
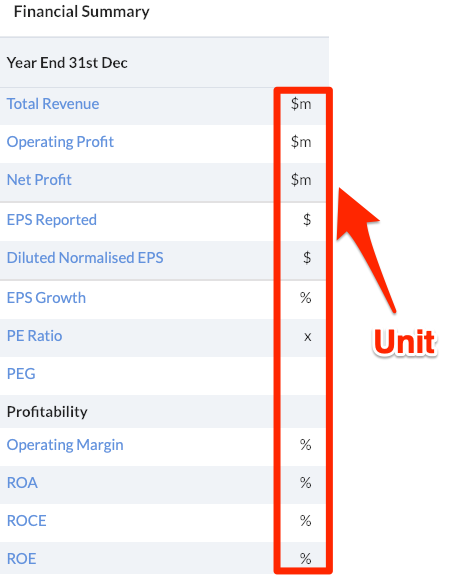
The rows in this financial summary relate to sets of key metrics that help you eyeball how the company has performed. Every row title can be clicked for a popup definition and displays its unit and currency in the unit column.
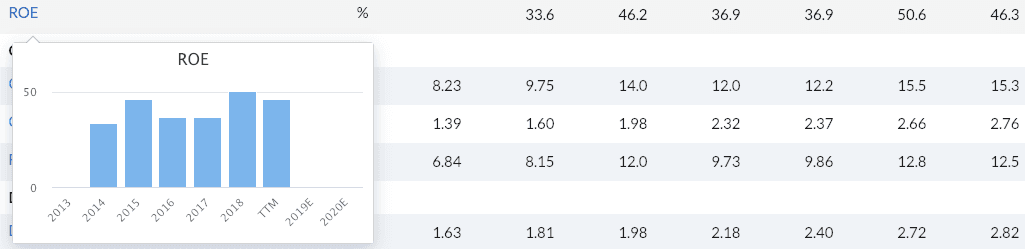
3. Popover Charts
Hovering over any row will display a popover chart. This may help with visualising the data.